
Adjust buyback ratios to compare token performance
It seems like we’d get a more interesting chart if we adjust for buyback ratios when comparing.
1) For virtuals, there wasn’t a direct virtual buyback mechanism. Instead, after post-bonding, a 1% trading fee was collected to the treasury, and with the accumulated $VIRTUAL they launched a program to buy back several major agent tokens using a 30-day TWAP.
2) For bonkfun GP, the buyback ratio was governed by governance and decreased in stages: 50% -> 40% -> 35% -> 0%. (Reference)
3) As everyone knows, pons and stonk allocate 80% and 60% of profits to buybacks, respectively.
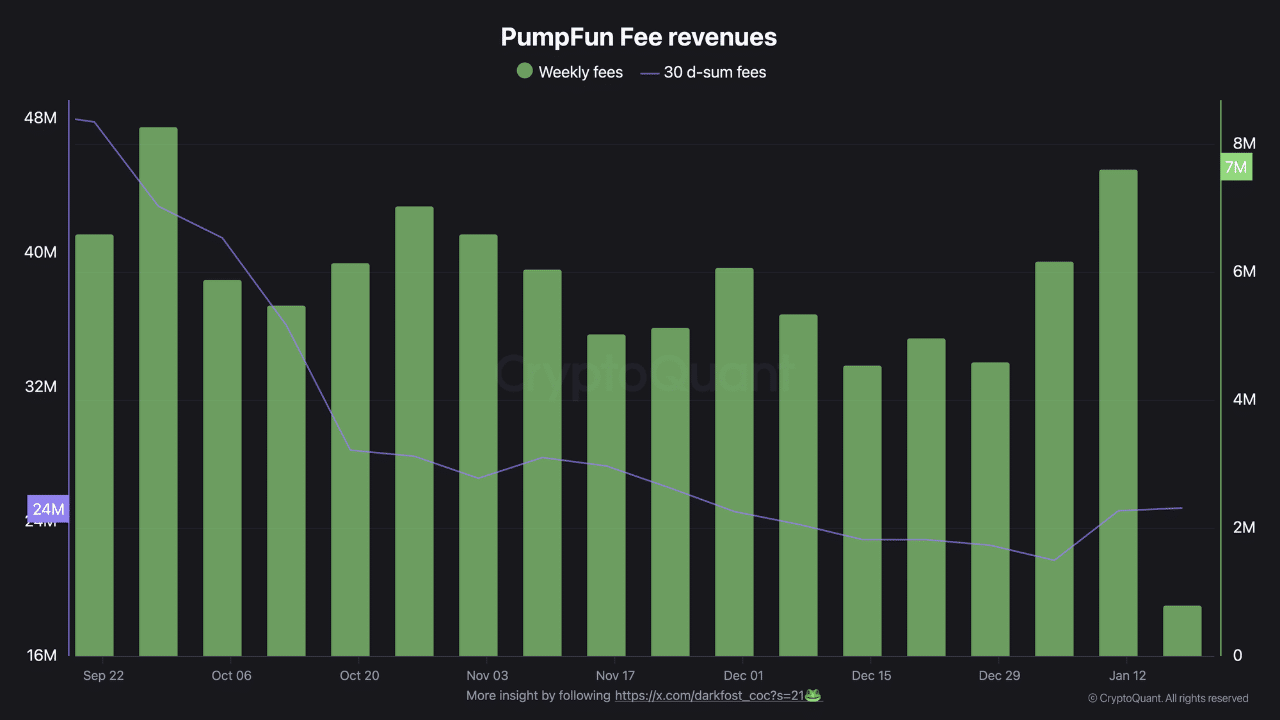
4) pump bought back 100% of profits from July 2025 to April 2026 and burned them in one go; since then, it has been buying back 50% of profits and burning them.
In the case of Virtual, it seems to be a rare example where the token price followed the narrative even without buyback pressure. Although it’s not listed on the site Dorong made, pump showed, over the long-term trend, that the chart tracked buyback pressure to some extent. Right now, expectations for pons and stonk seem to be really high.