Analyst forecasts Bitcoin will hit $200,000, flags $60k–$70k buy zone
Monthly chart maps path to $200k Bitcoin; “buy zone” marked at $60k–$70k
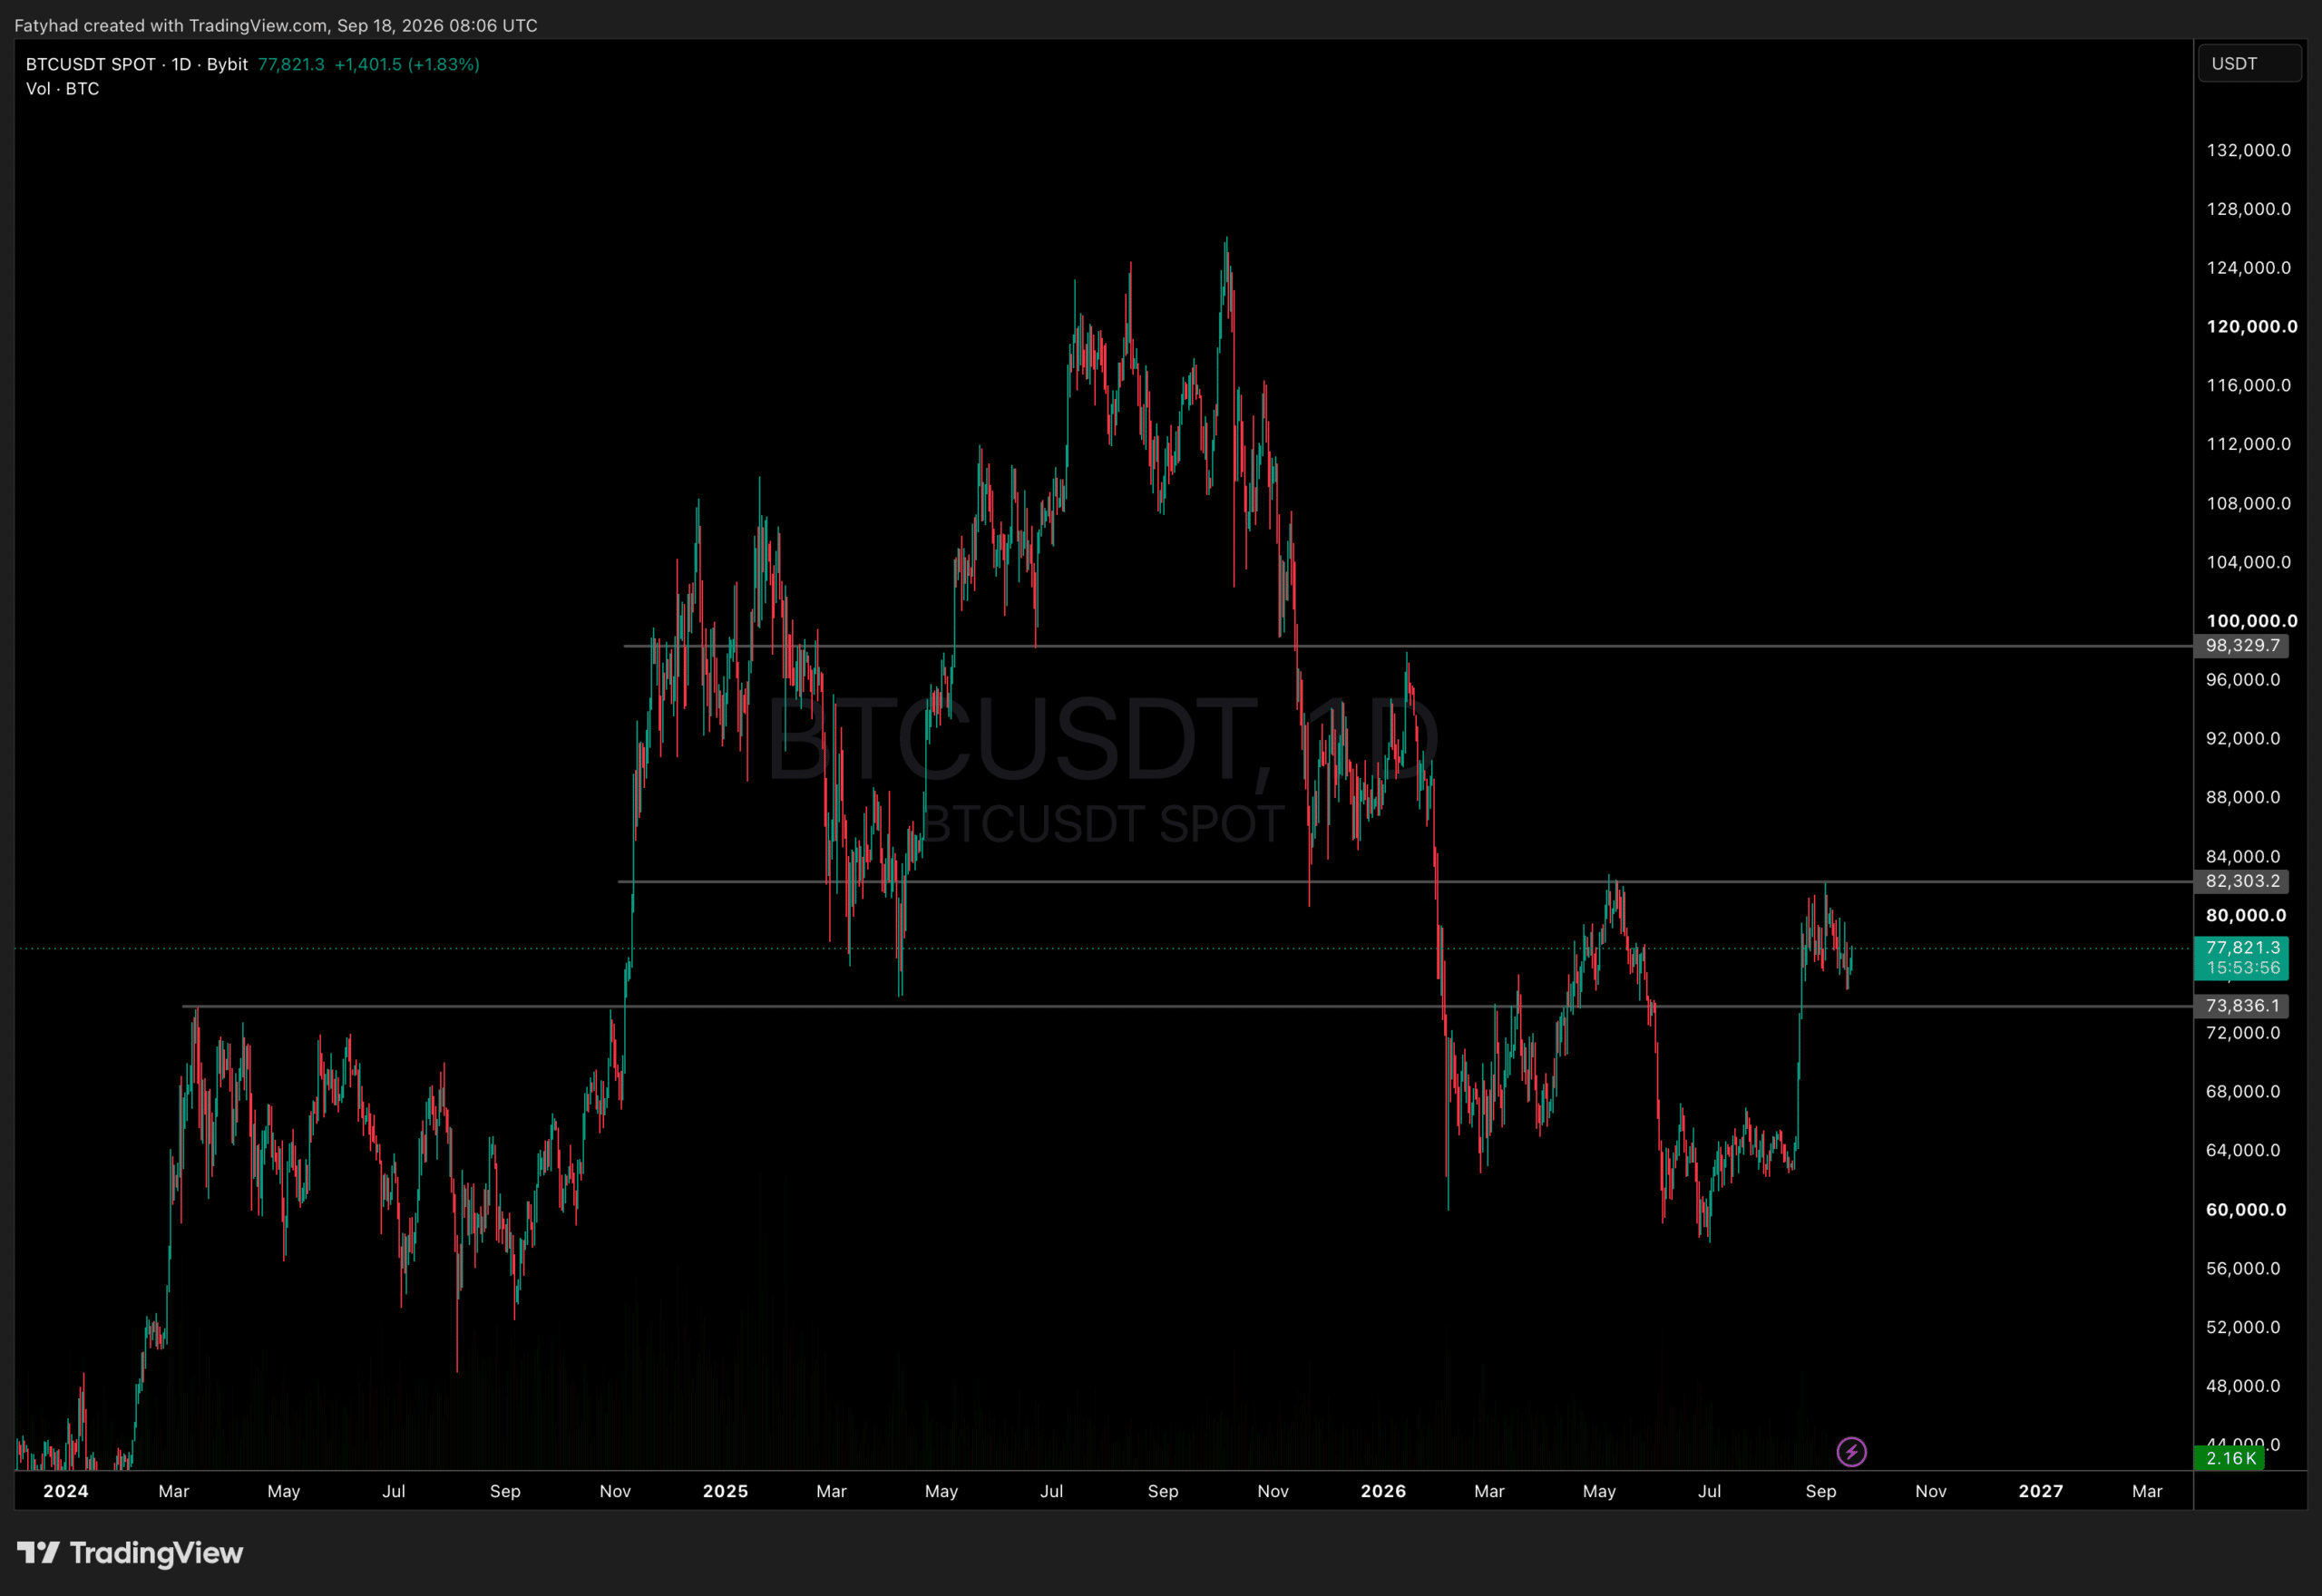
An analyst sees a $200,000 target for Bitcoin based on a recurring monthly cycle. The setup tags the current range as accumulation, with price near $77,880.
The call comes from Bitcoin Teddy’s monthly chart. He outlines three cycle phases with “buy zones” near a curved support that links prior lows. Source: his chart on X.
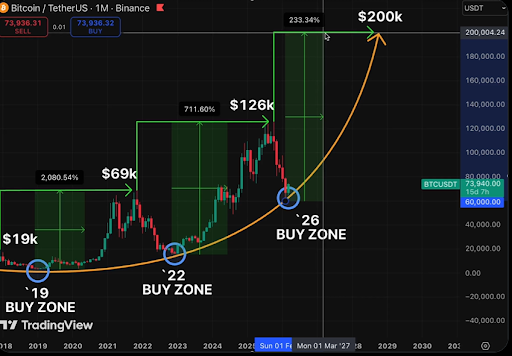
The first zone showed in 2019 before the run past $69,000. The second hit in late 2022 ahead of an October 2025 peak near $126,000. The third is labeled “2026 buy zone,” with a projected top at $200,000. Source: chart post.
Rally sizes are compressing:
- 2019 to 2021 peak: over 2,000% source
- 2022 to current peak: over 700% source
- Current zone to $200,000: about 233% source
Entry timing is part of the thesis. The preferred area sits between the long-term curve and the lower edge of the latest green box, roughly the $60,000s to $70,000s. The blue circle sits near the February corrective low. Sources: Bitcoinist on the setup, chart.
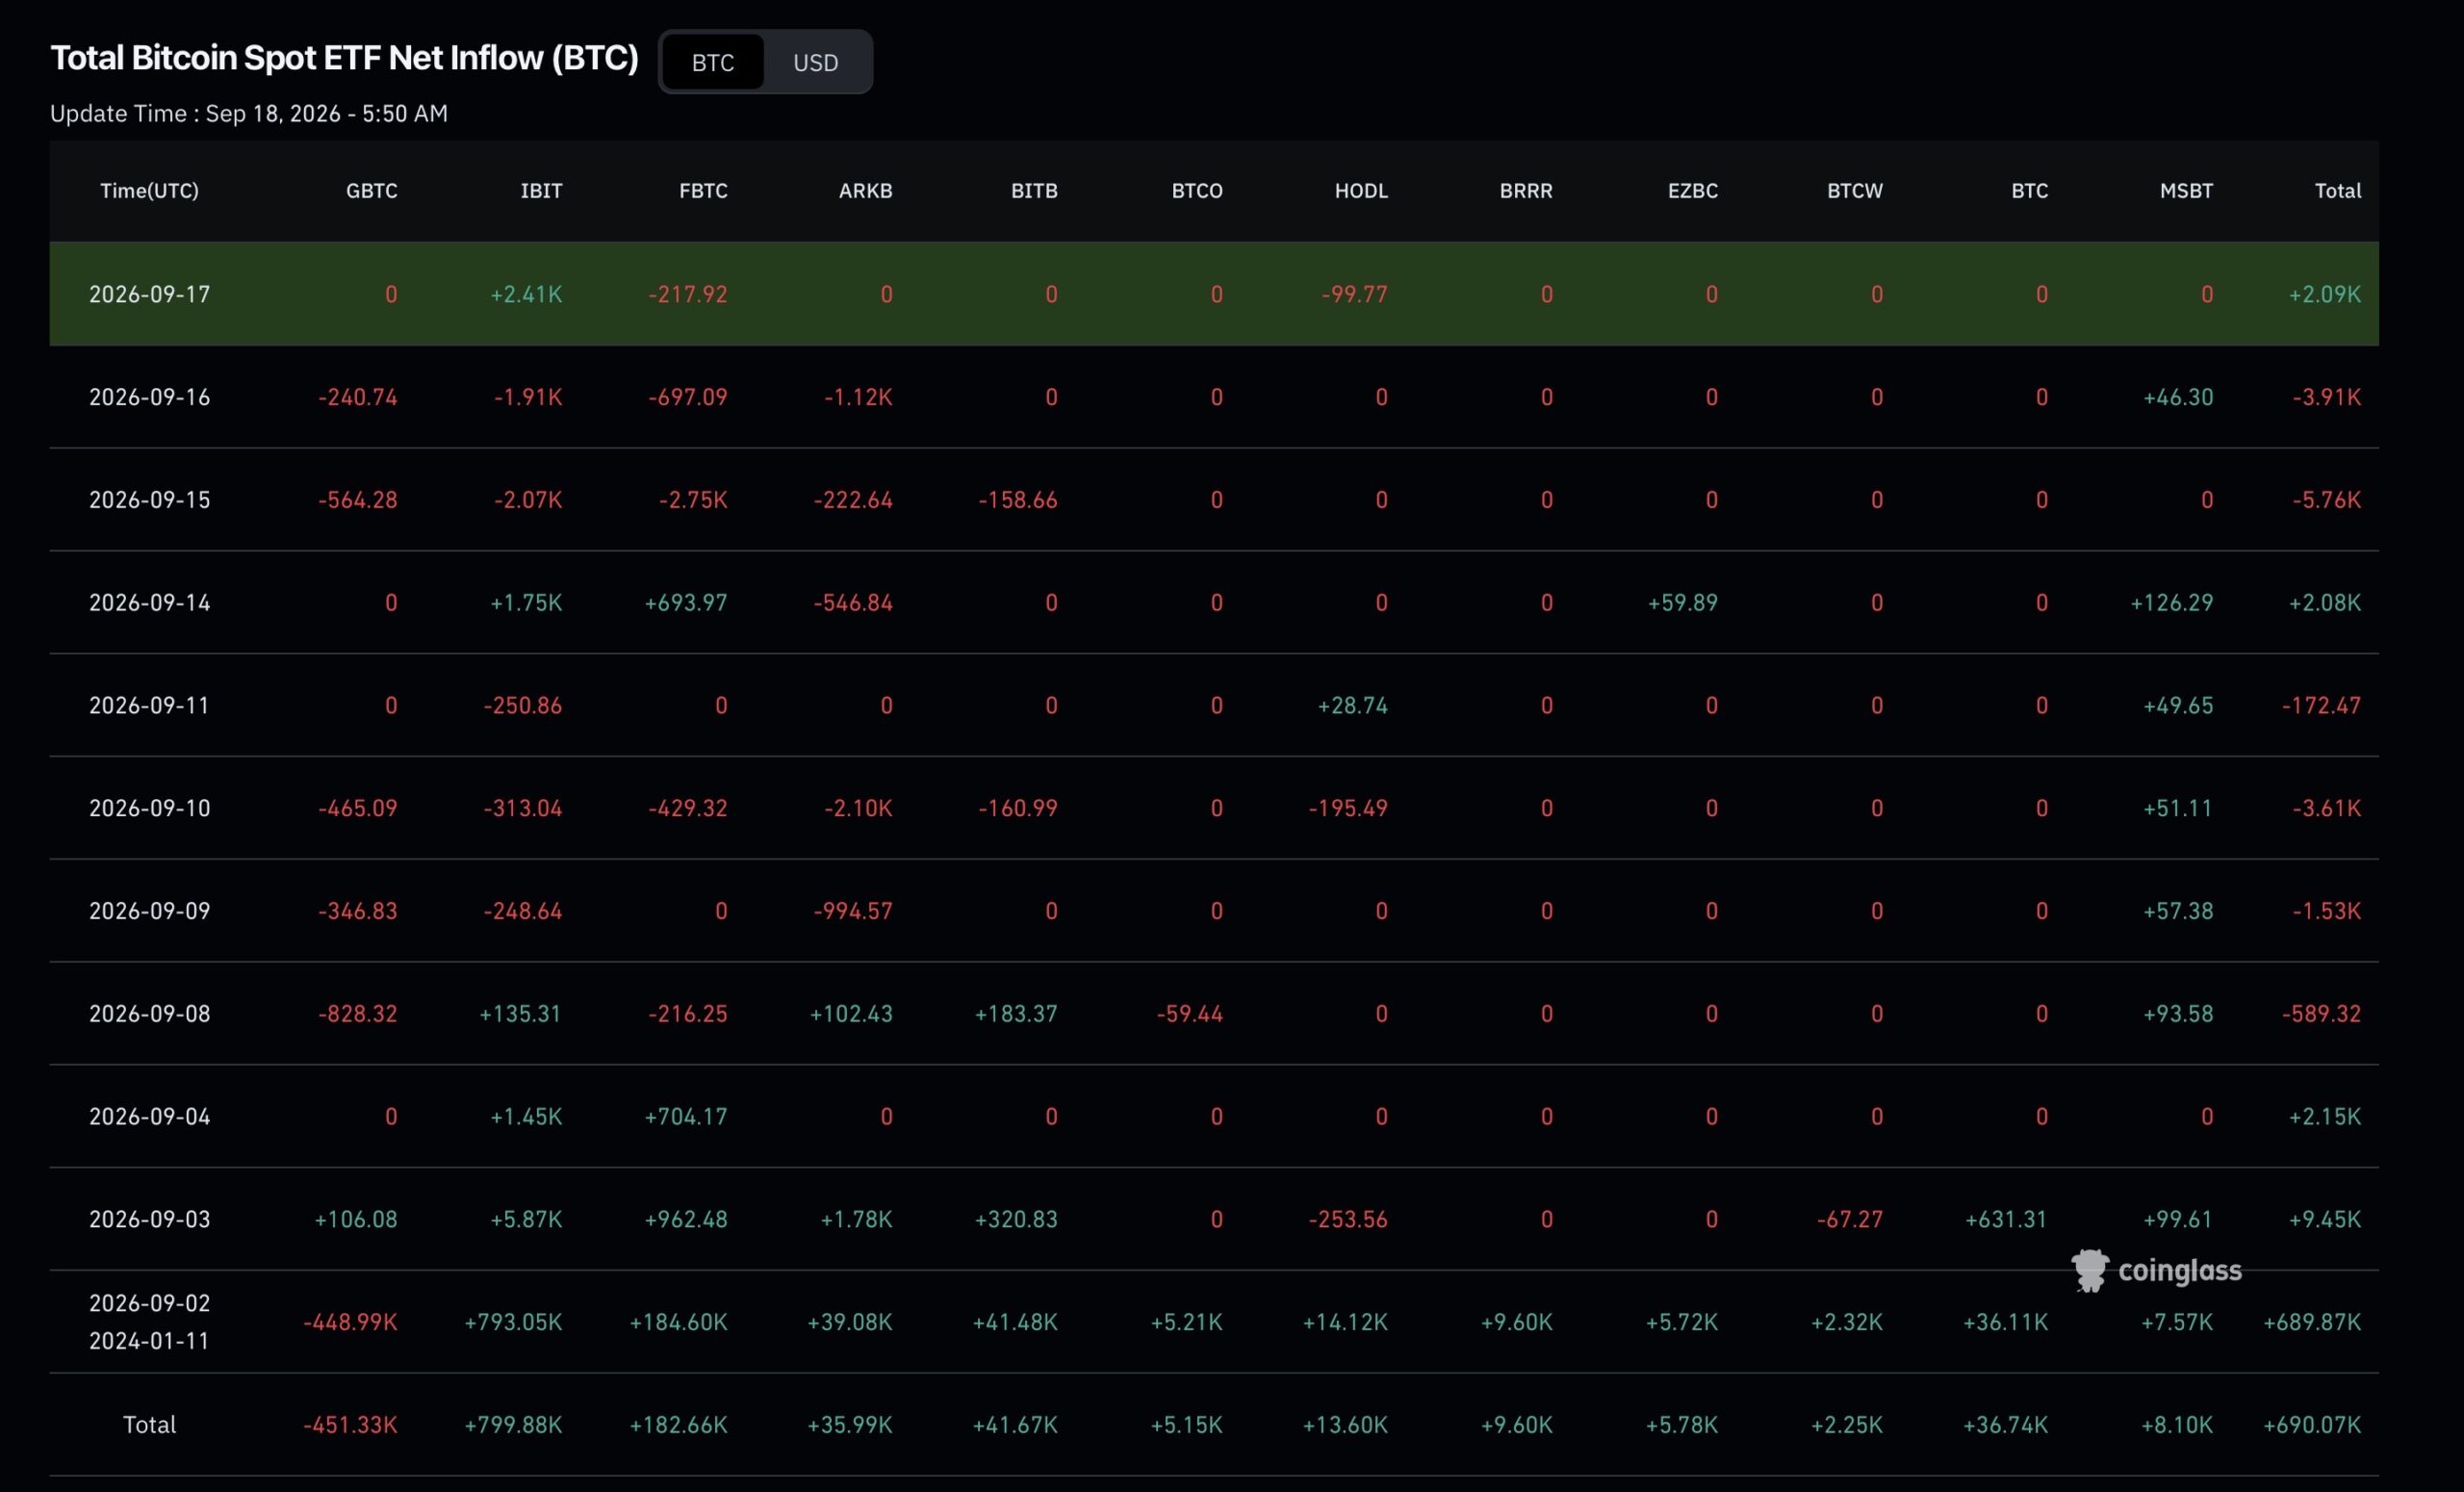
Price rebounded from that February low. Spot ETF inflows returned to steadier levels. The price still sits inside the highlighted accumulation band on the chart. Sources: NewsBTC on the rebound, Bitcoinist on ETF inflows, chart.
From ~$77,000 to $200,000 implies about 156% upside. Several institutions see that as feasible within this cycle window. Source: NewsBTC on cycle targets.
Wall Street keeps building products. Goldman Sachs filed for its first Bitcoin ETF soon after Morgan Stanley launched its spot ETF on NYSE. Sources: Bitcoinist on Goldman filing, NewsBTC on Morgan Stanley ETF.
Short‑term sentiment remains mixed. Source: X post.