Bitcoin falls below $72,000 as sellers target $70,500 and $70,000
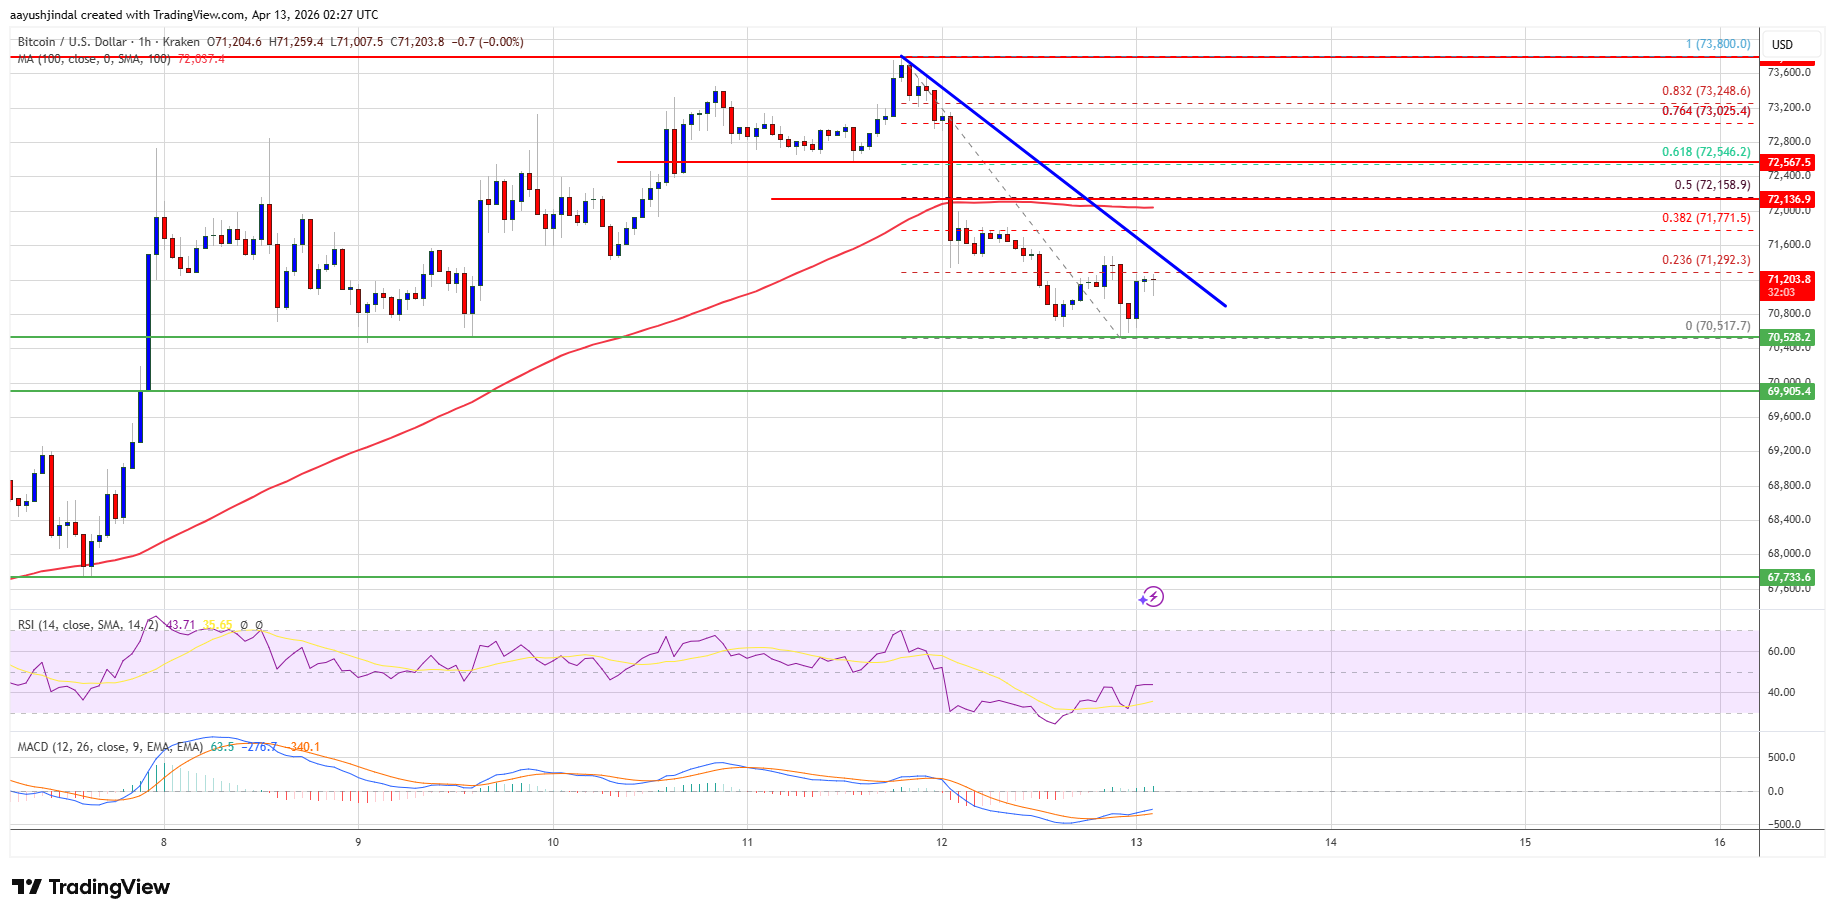
Bitcoin slips from $73,800 and tests $70,517. Price sits below $72,000 and the 100‑hour SMA. A bearish trendline caps near $71,450.
Buyers lost $72,500. NewsBTC reports a push down after a top at $73,800. The drop cut through $71,500 and $71,200.
Bitcoin now consolidates under the 23.6% Fib of the $73,800–$70,517 move. It trades below $72,000 and the 100‑hour SMA, as noted by NewsBTC.
Key levels to watch:
- Resistance: $71,450 trendline, $71,500, then $72,000. A close above $72,000 opens $72,500, then $73,200 and $74,000 (source)
- Support: $70,800, $70,500, then $70,000. Below that, $69,200. Main support at $68,800 (source)
Momentum weakens. The hourly MACD accelerates in bearish territory. RSI sits below 50 (source).
Below $71,500–$72,000, downside risk persists. Holding $70,500 keeps a rebound attempt in play (source).