Bitcoin RSI hits four-year low, hinting at potential 200% rebound
Bitcoin’s daily RSI just hit 21.8, a 4‑year low. A rare signal that marked past bottoms has flashed again.
Investor sentiment deteriorated in recent days, but a historically rare demand signal reappeared on the daily RSI, last seen near the 2022 low, according to sector reports. Bitcoin sold off below $60,000 over the weekend as the RSI dropped to 21.8 and remains in the mid‑20s, deep in oversold territory.
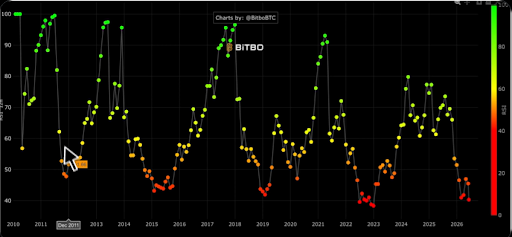
- RSI context. The indicator fell to 21.8 during the weekend drawdown and sits in a rare bottom zone on the daily timeframe. Links: RSI low at 21.8, rare demand signal.
- Analyst view. Crypto Tice mapped today’s RSI zone to prior cycle lows in 2011, 2015, 2018‑2019, and 2022, and flags potential for more than a routine bounce. Link: analyst chart and commentary.
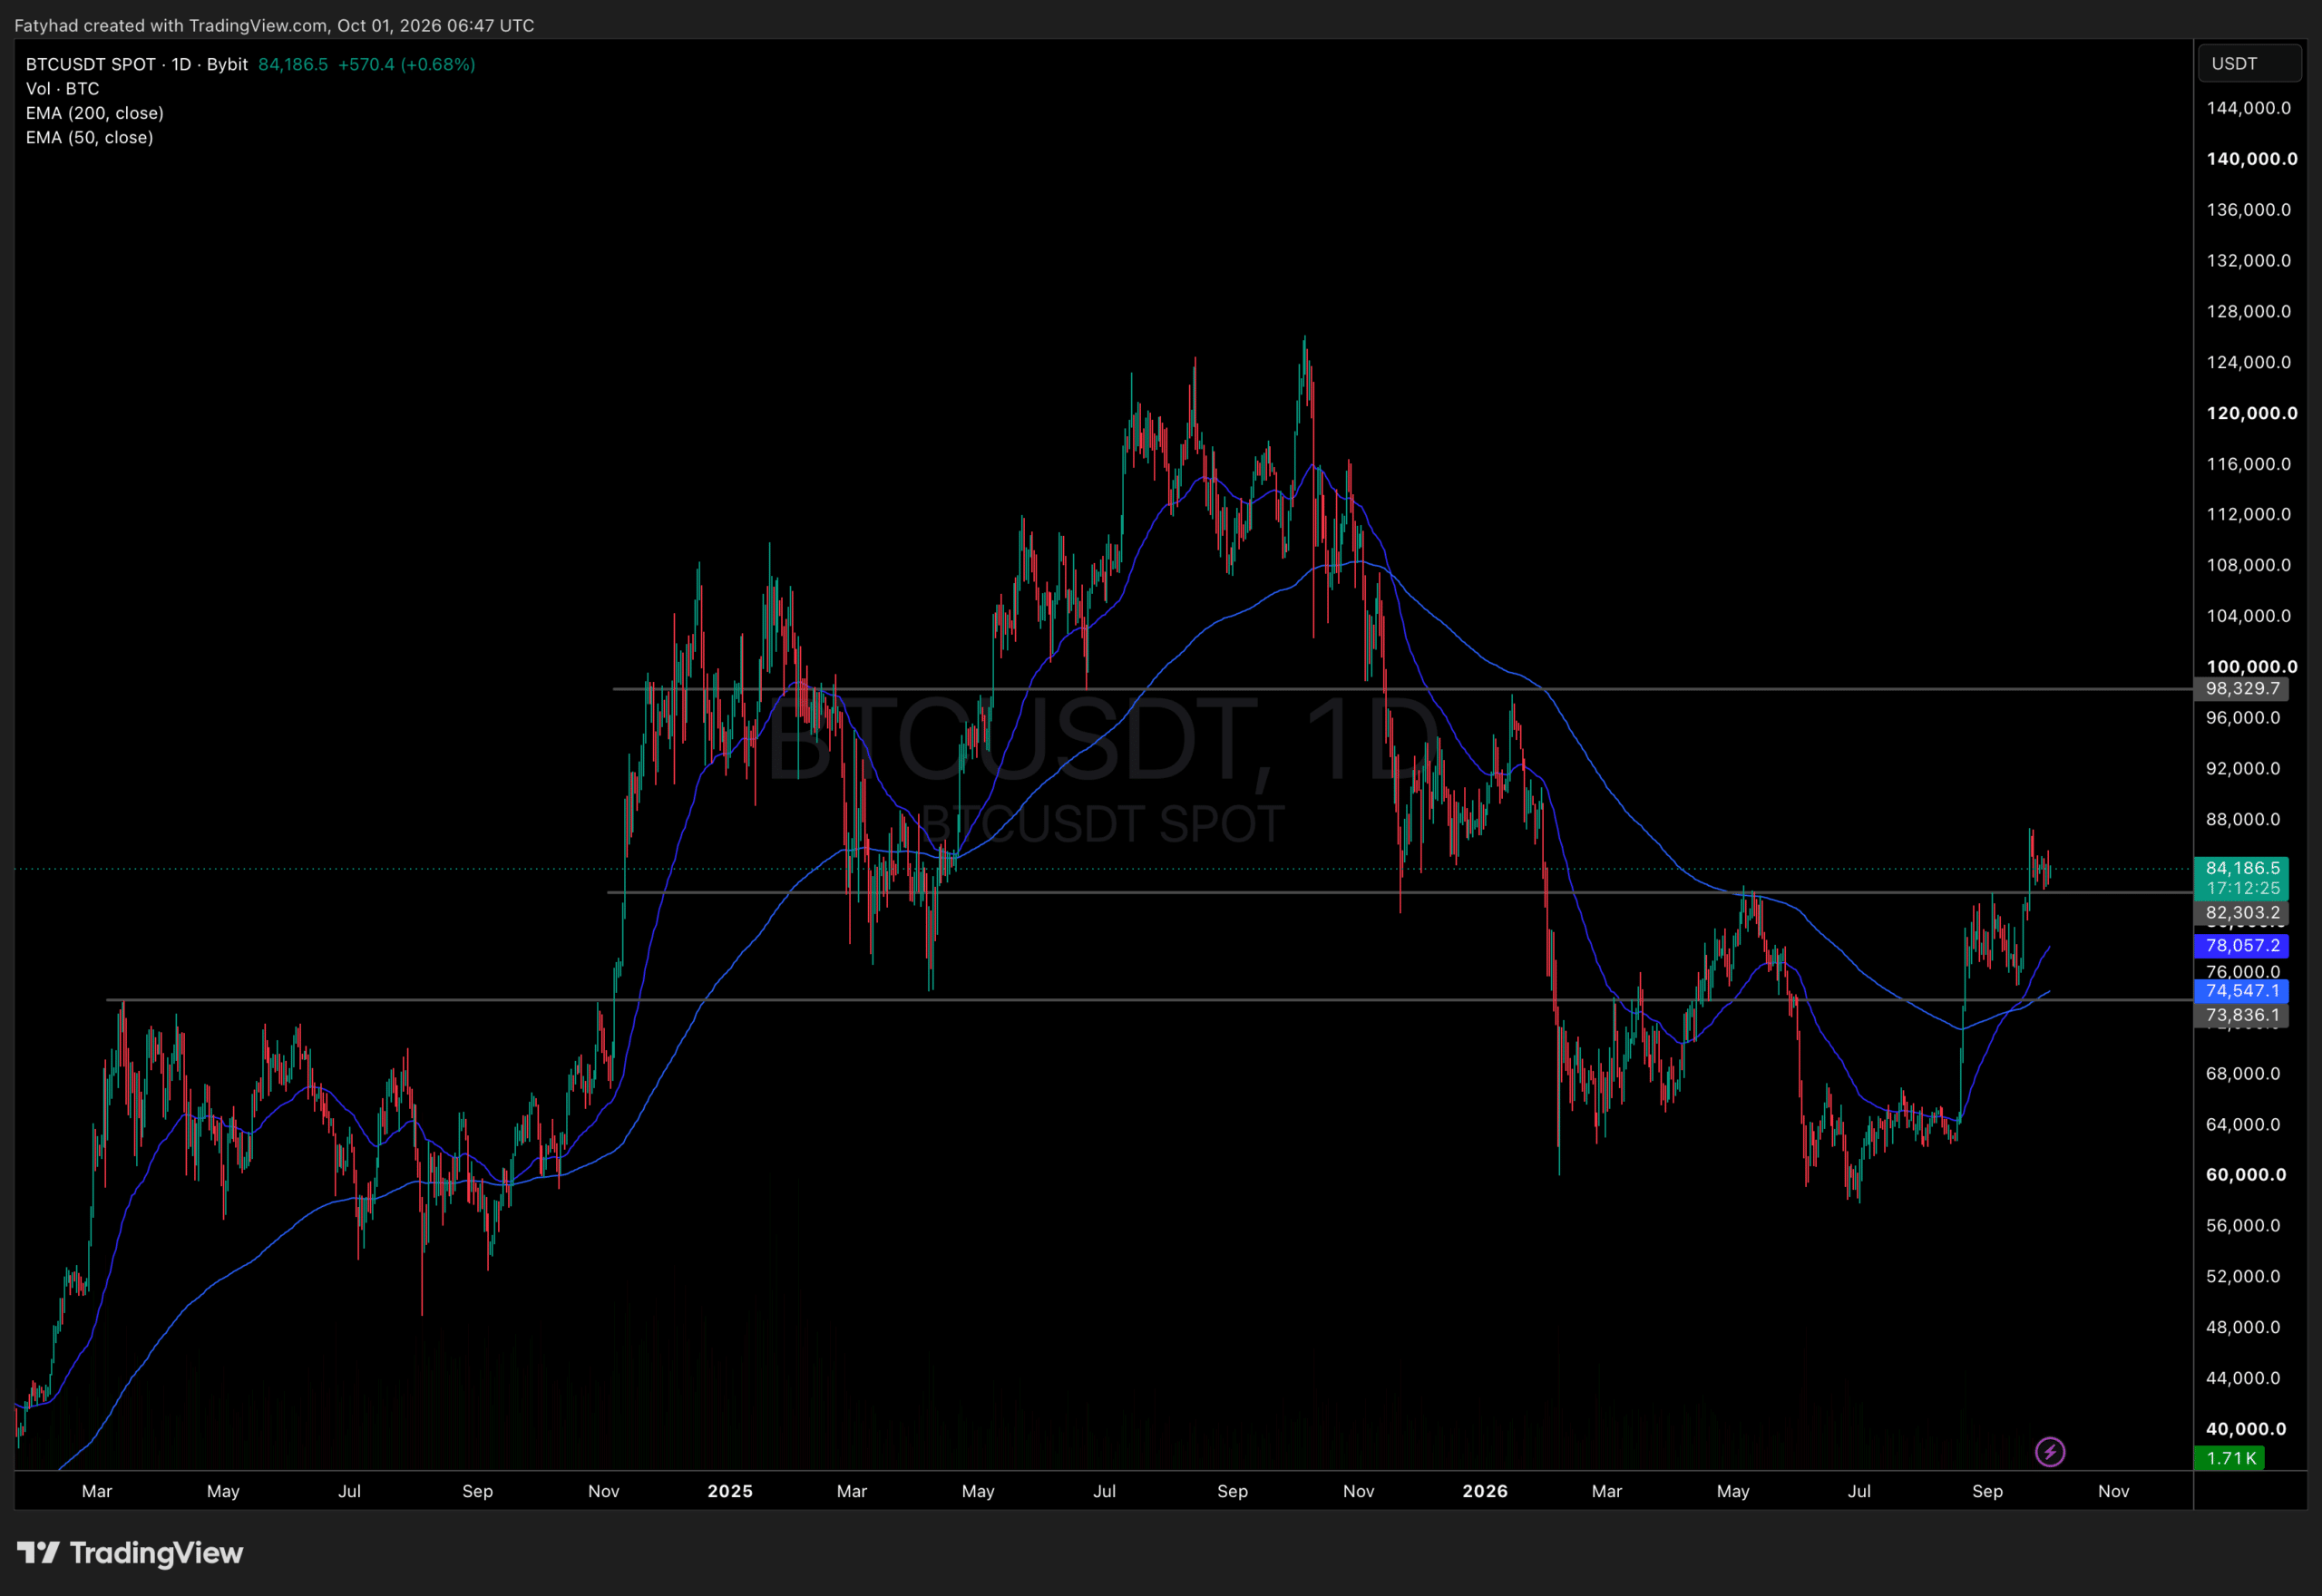
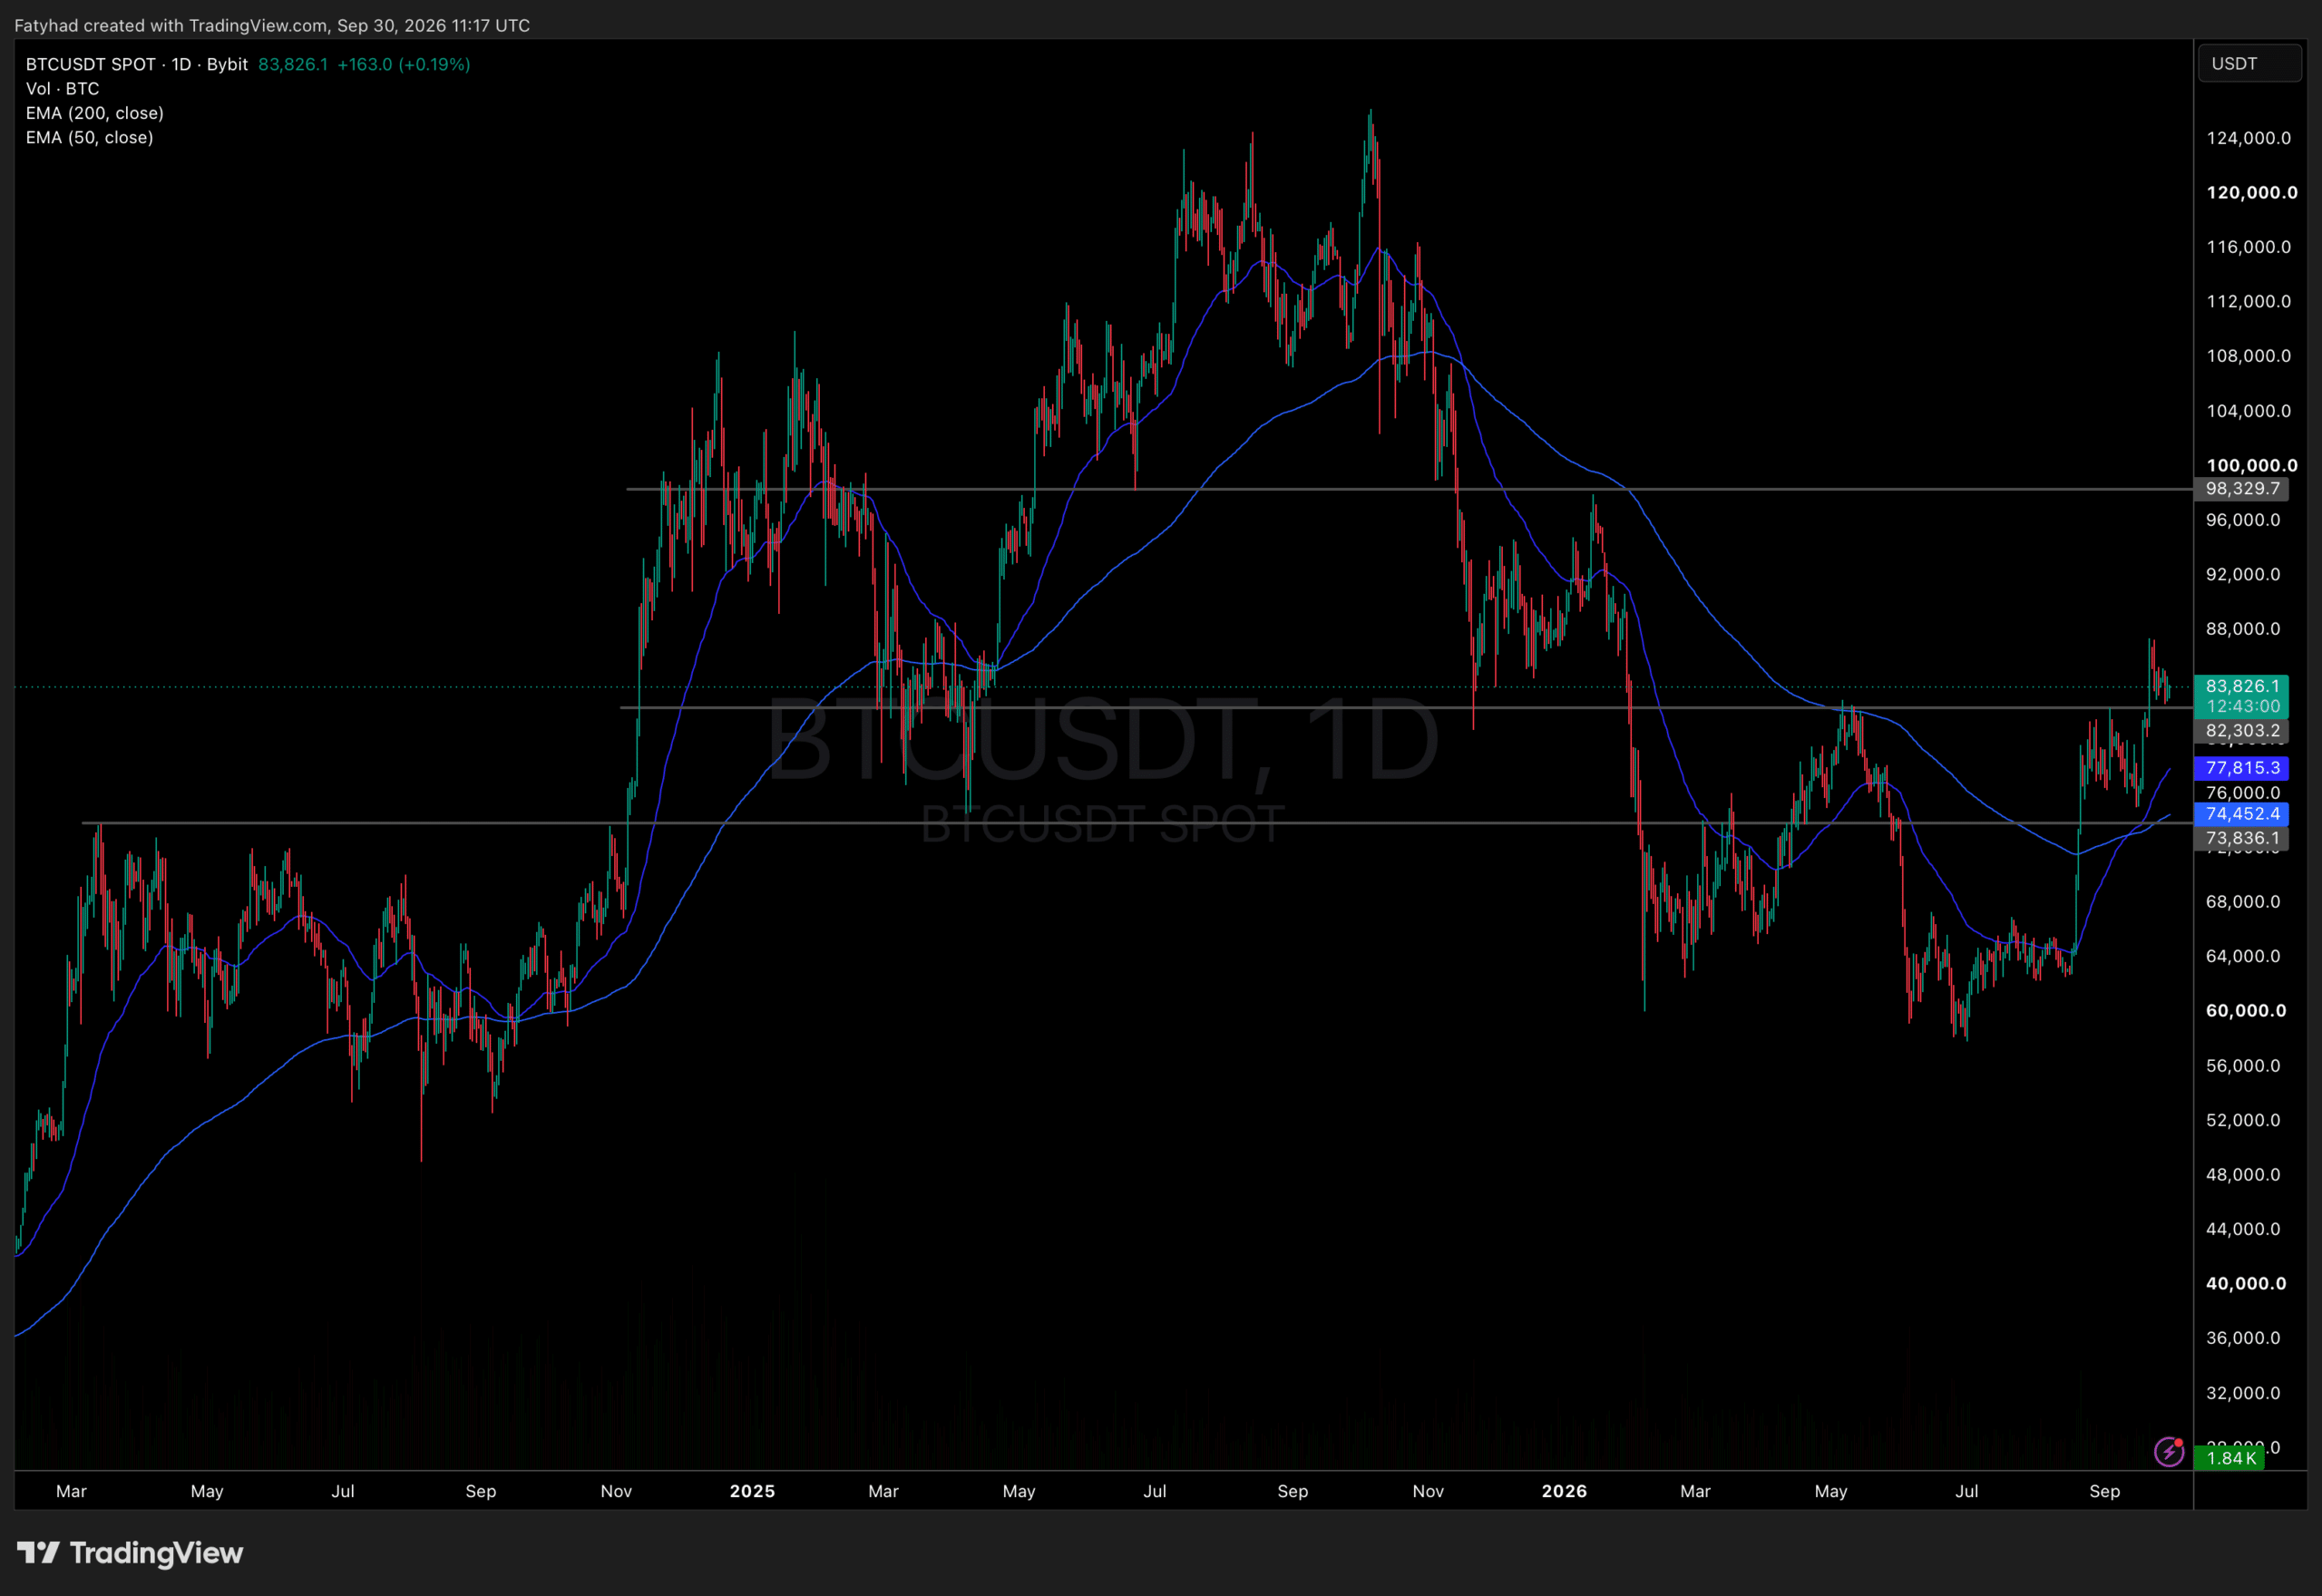
- Price and drawdown. Price dipped below $60,000 for the first time since 2024 and now trades around $61,000–$63,000, down about 50% from the October 2025 peak above $126,000. Links: current range.
- Historical analog. In 2022, deeply oversold RSI coincided with a ~$15,500 low that preceded a move to ~$70,000 by 2024, a gain of 350% from the bottom. Links: 2022 bottom analog.
- Scenario mapping. If a base forms near $60,000, a 200% rally would target ~$180,000; a full 2022‑2024‑style recovery implies levels above $200,000. Links: 200% case, above $200,000 case.
- Flows backdrop. Spot Bitcoin ETFs resumed outflows, complicating bottom calls; RSI’s signal needs sustained demand. Link: ETF flows and bottom indicator.
Additional context on sentiment trends: recent sentiment readings.