March on-chain data shows capital rotating from Bitcoin to Ethereum
XWIN: ETH +7.12% in March, BTC cap −0.43% — capital rotated
March data show rotation into Ethereum and out of Bitcoin. On‑chain signals back it as price tests $2,200.
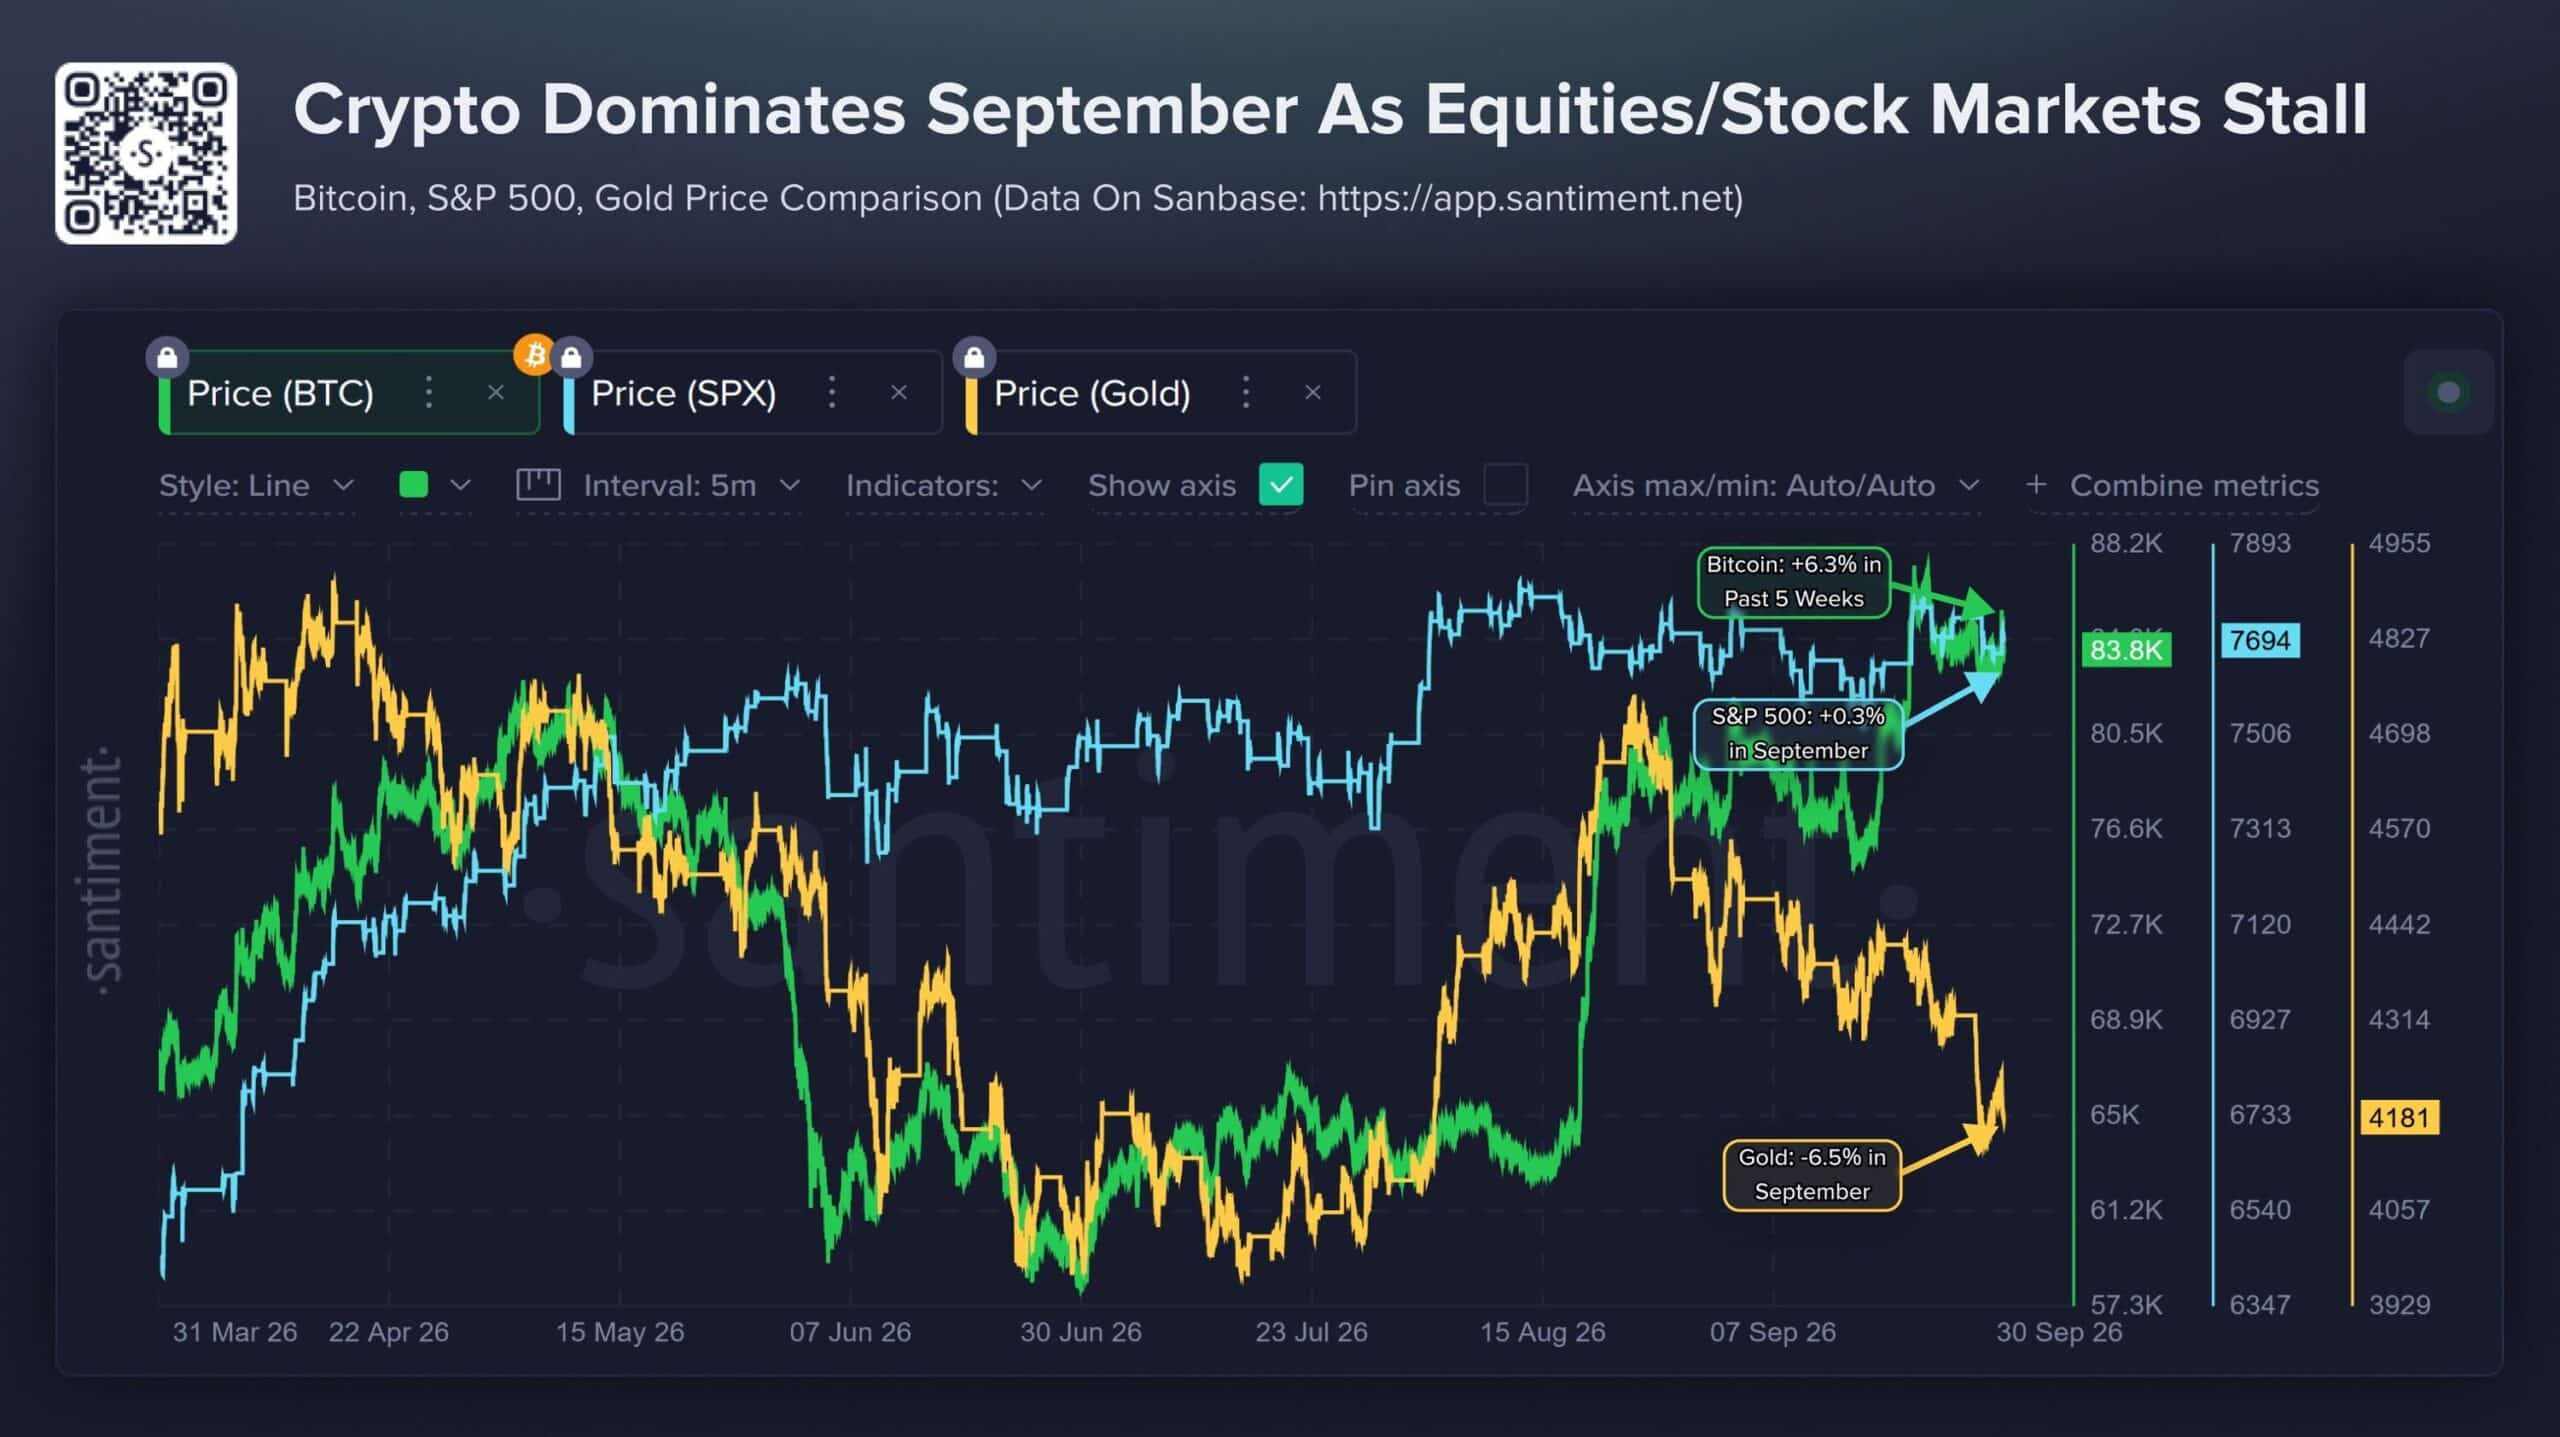
In March, BTC rose 1.83% while ETH gained 7.12%. The divergence sits in market caps: BTC fell 0.43% as ETH grew 2.97%, indicating reallocation, not momentum drift (CryptoQuant quicktake by XWIN Research Japan).
ETH behaved as higher beta. Realized vol hit 62.8% vs BTC’s 49.8%, with correlation near 0.94. ETH amplified liquidity and risk appetite shifts more strongly (XWIN).
- Exchange outflows in ETH keep rising, thinning immediate sell‑side supply (XWIN).
- Coinbase Premium Gap is still negative but improving, signaling early US demand recovery (XWIN).
- Active addresses trend higher, confirming growing network use independent of price (XWIN).
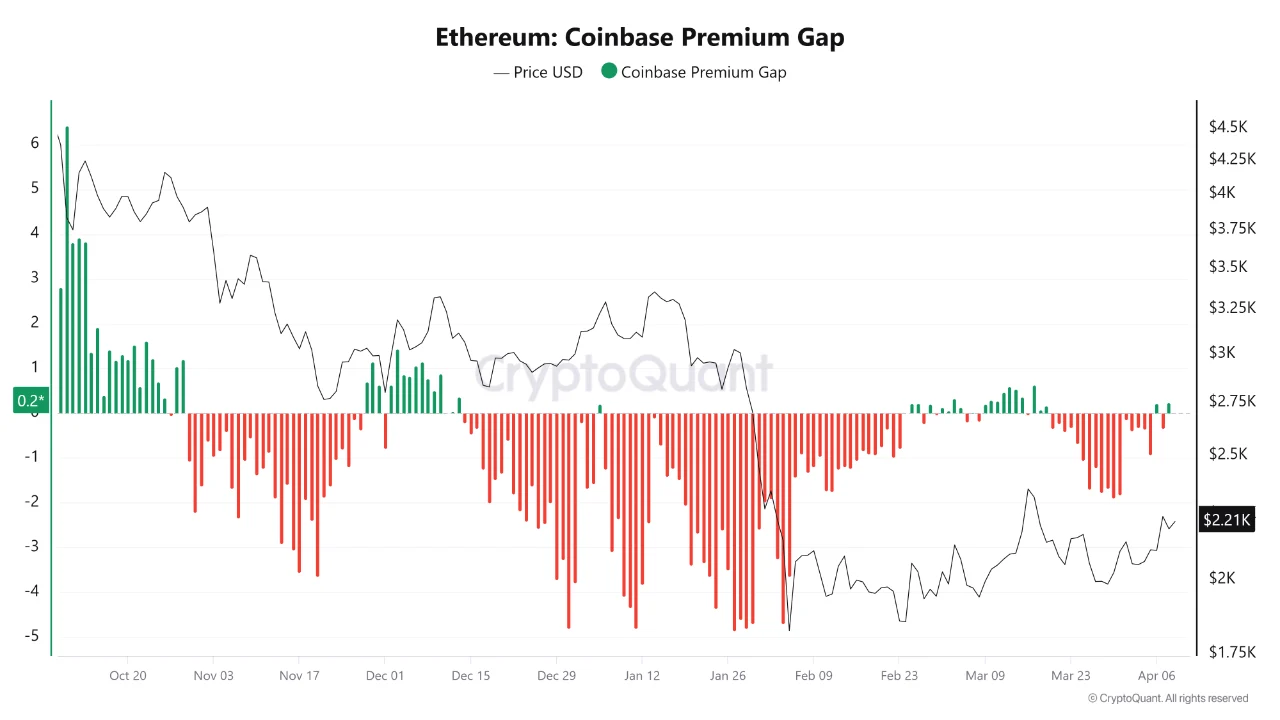
The report frames BTC as monetary SoV and ETH as financial infrastructure used for stablecoins, DeFi, tokenization, and settlement. With real usage expanding and institutions only starting to return, the infrastructure asset tends to re‑rate earlier (XWIN).
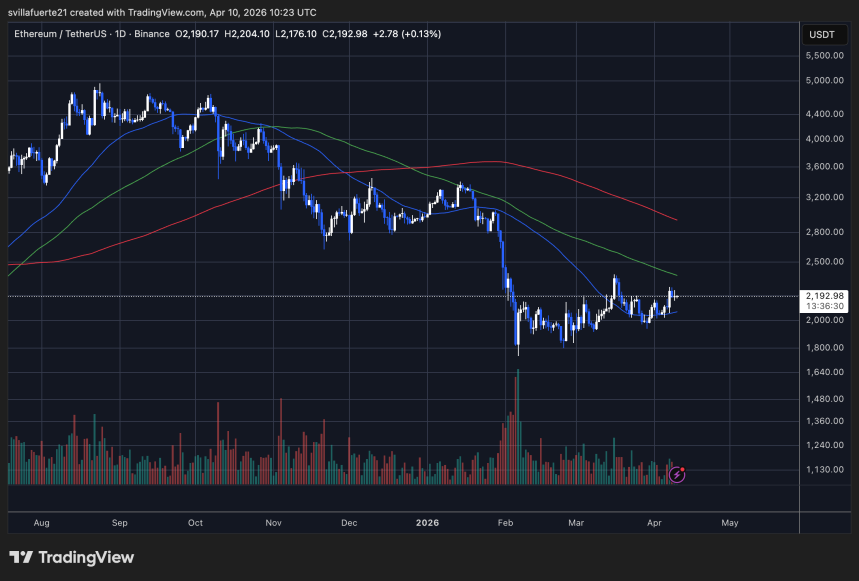
ETH’s post‑February structure is stabilizing. A capitulation drop was followed by consolidation and higher lows. Price trades near $2,200, now a short‑term pivot. The 100D and 200D MAs slope down above price; the 50D is flattening with price interacting around it. Volume spiked on the February flush, then normalized, reducing stress. A confirmed shift needs a sustained break above $2,400–$2,600 where the 100D sits (chart evidence below).