
US CPI report today may sway Bitcoin and December Fed hike odds
The U.S. Bureau of Labor Statistics will publish October’s CPI on Tuesday, November 10, at 8:30 a.m. New York time. Economists expect core CPI to rise about 0.22% month over month, slower than September’s 0.33%. Bitcoin trades near $74,400, close to Sunday’s two-month low of $73,510. Historical data shows cooler CPI prints often coincide with a positive first-hour BTC move, while hotter prints correlate with weakness.
Economists’ Baseline and Range
Seventeen banks and research firms surveyed by The Wall Street Journal see a median rise of 0.25% for headline CPI and 0.22% for core. Forecast dispersion implies the core reading could round to 0.1%, 0.2%, or 0.3%.
- Headline CPI: estimates from 0.14% at Nomura to 0.29% at Pinebrook Capital, versus 0.65% in September.
- Core CPI: estimates from 0.13% at Nomura to 0.28% at BNP Paribas and Pinebrook, versus 0.33% in September.
- Yearly rate: September was 3.7% headline and 2.6% core. The October 2025 government shutdown limits clean year-over-year comparisons.
Economists expect growth in the core CPI to have moderated in October to around 0.22%, though the full range of estimates is broad enough to round down to 0.1% or round up to 0.3%.
Due to the government shutdown in Oct 2025, there's no tidy year-earlier figure. pic.twitter.com/CFM7ikw8fO
— Nick Timiraos (@NickTimiraos) November 9, 2026
Fed Context and Market Odds
This is the last CPI before the Federal Reserve’s December 8-9 meeting. Polymarket shows an 86.5% probability of a 25 bp hike and 11.5% for no change. Higher rates increase cash and bond yields, which can pressure non-yielding assets like Bitcoin. A cooler CPI could trim hike odds; a hotter print would reinforce them.
BTC Reaction Pattern on CPI Days
Across the last 24 CPI releases since October 2024, Bitcoin’s first hour after 8:30 a.m. shows larger swings and a directional tilt tied to the core print:
- Volatility: median high–low range in the first hour was 1.17%, versus 0.62% in the same hour on other weekdays.
- Core ≤ 0.2% (13 reports): BTC rose 10 times, average +0.45% in the first hour.
- Core ≥ 0.3% (10 reports): BTC rose 4 times, average −0.11% in the first hour.
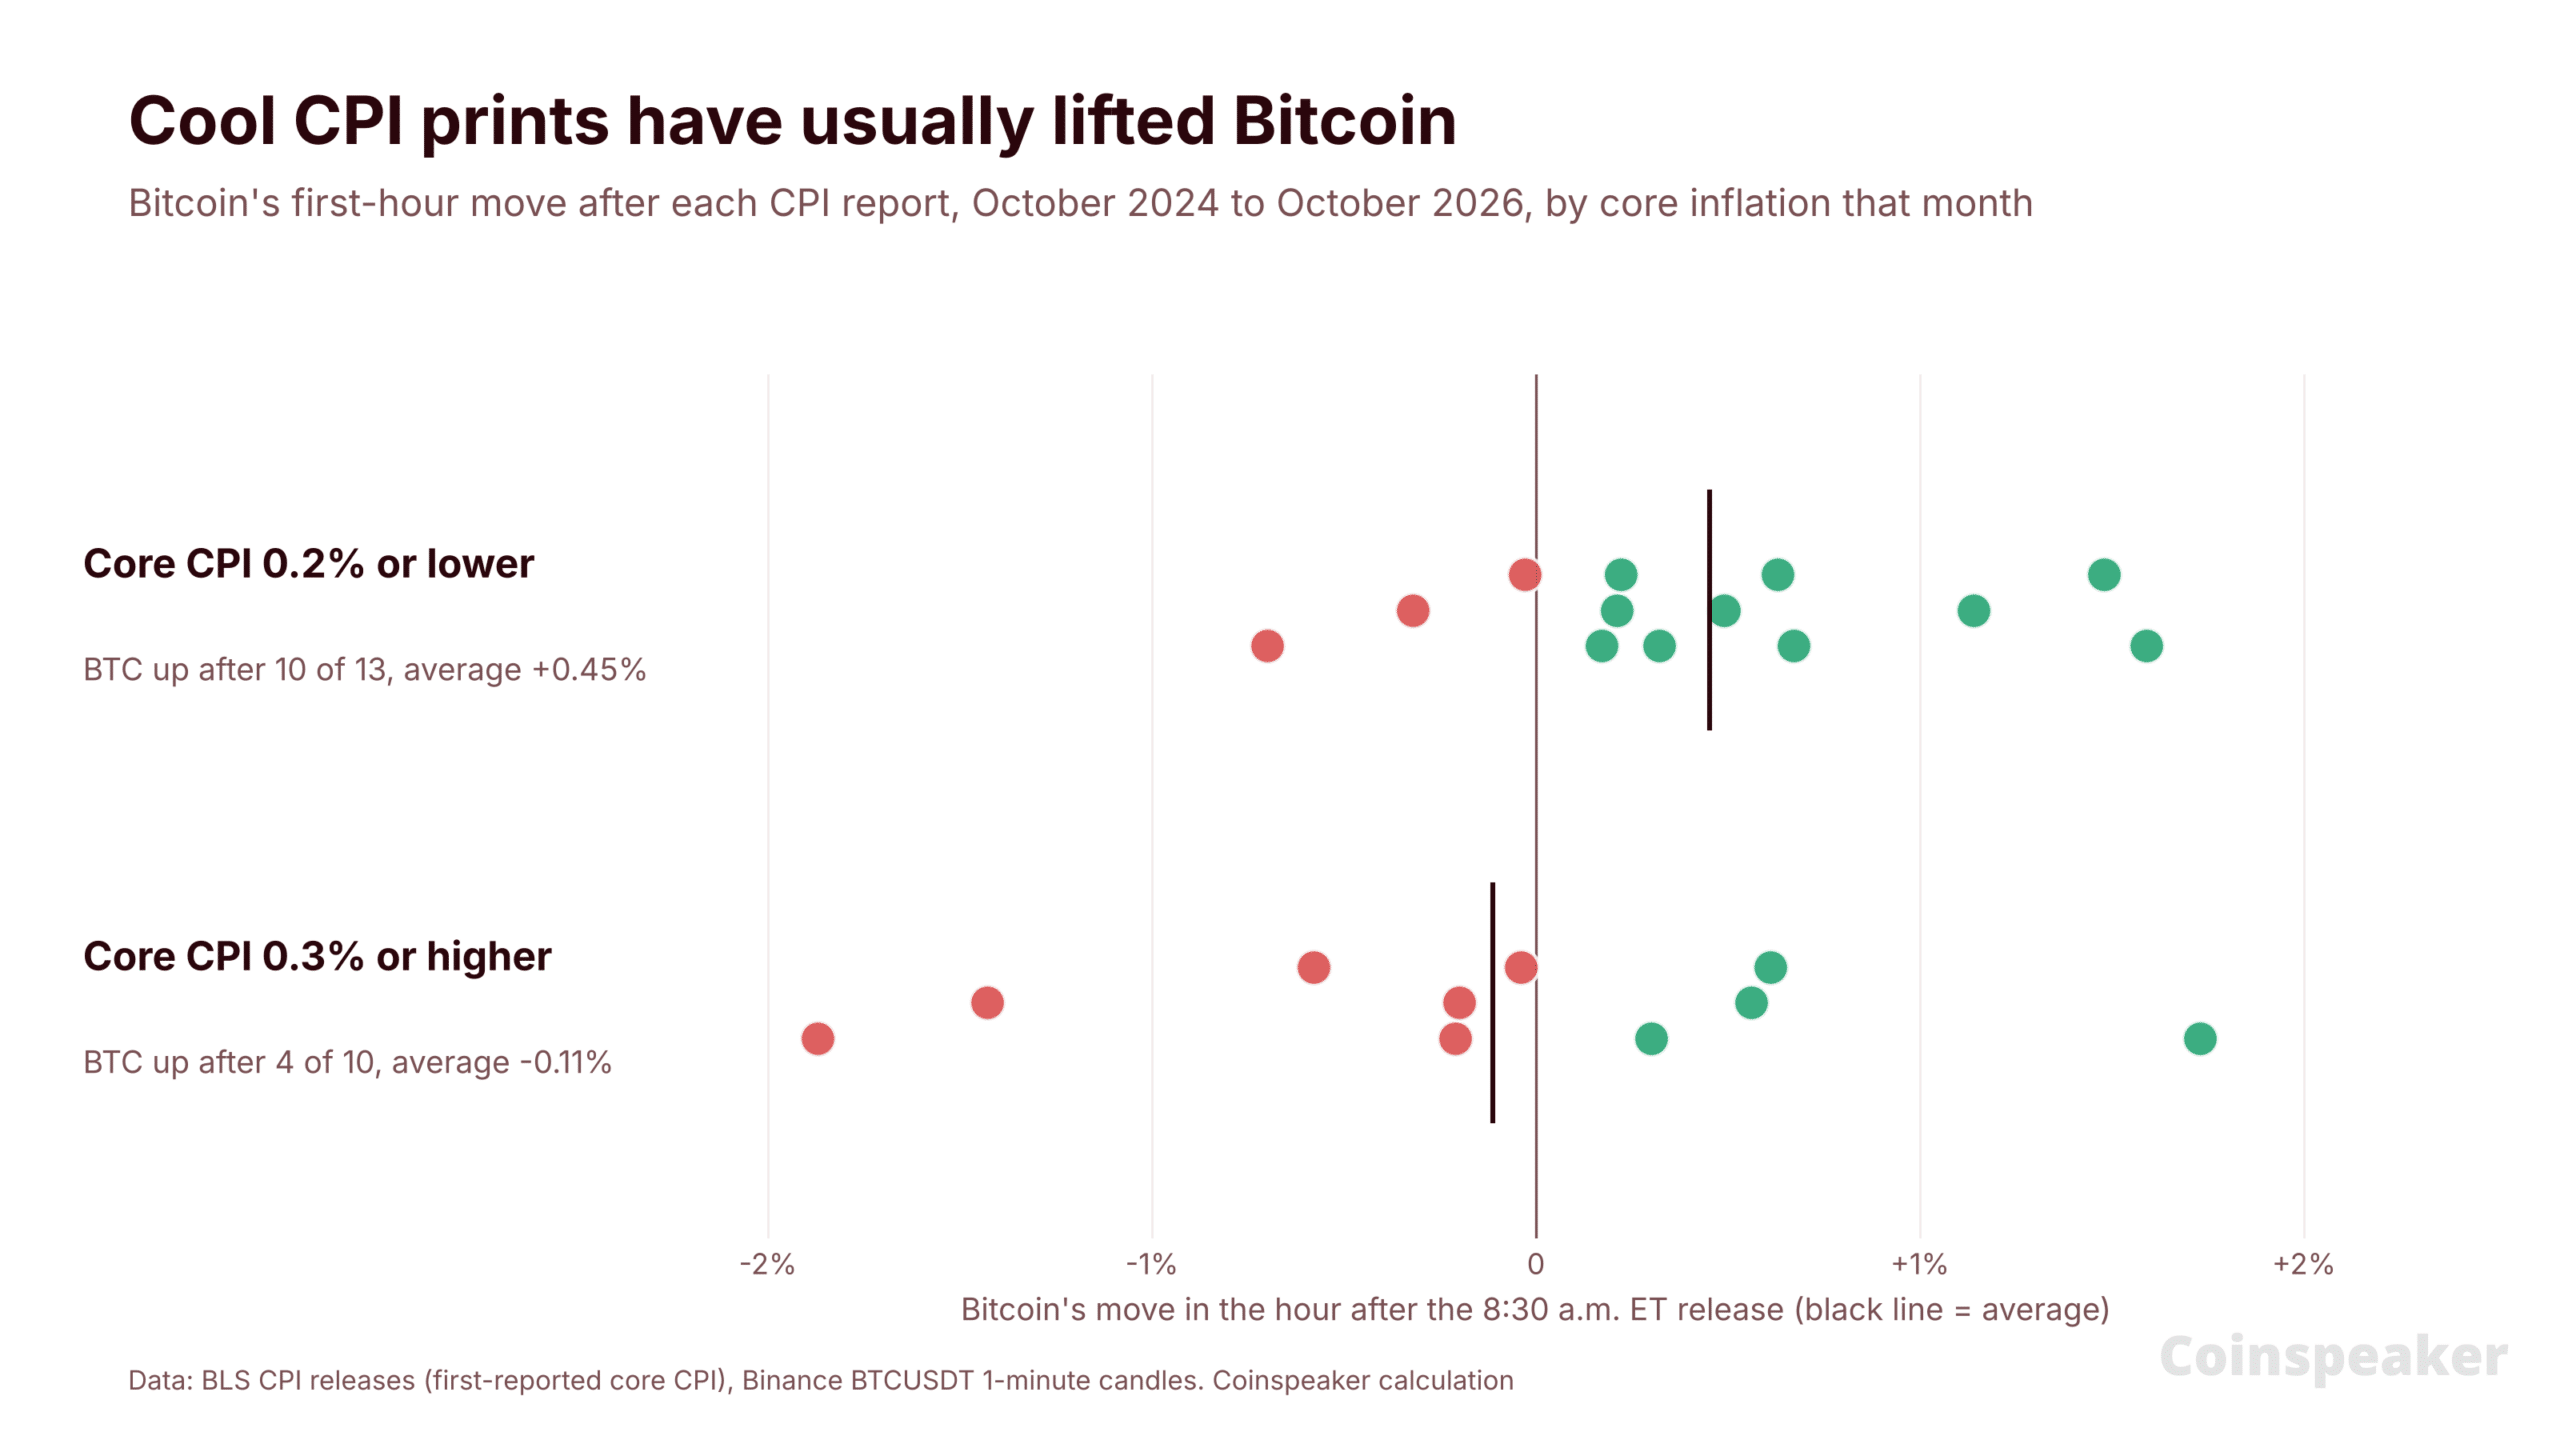
Largest recent downside: February 12, 2025, core at 0.4%, BTC −1.9% in the first hour. Last month’s 0.3% reading saw −1.4%.
Bitcoin Price Levels Into the Print
BTC trades at $74,398 on Binance, about 1.2% above Sunday’s low. On the daily chart, price sits below both EMAs: 200-day at $76,481 and 50-day at $79,128.
- Resistance: $75,599, then $76,481, then $79,128.
- Support: $74,177, then $73,510, then $73,027.
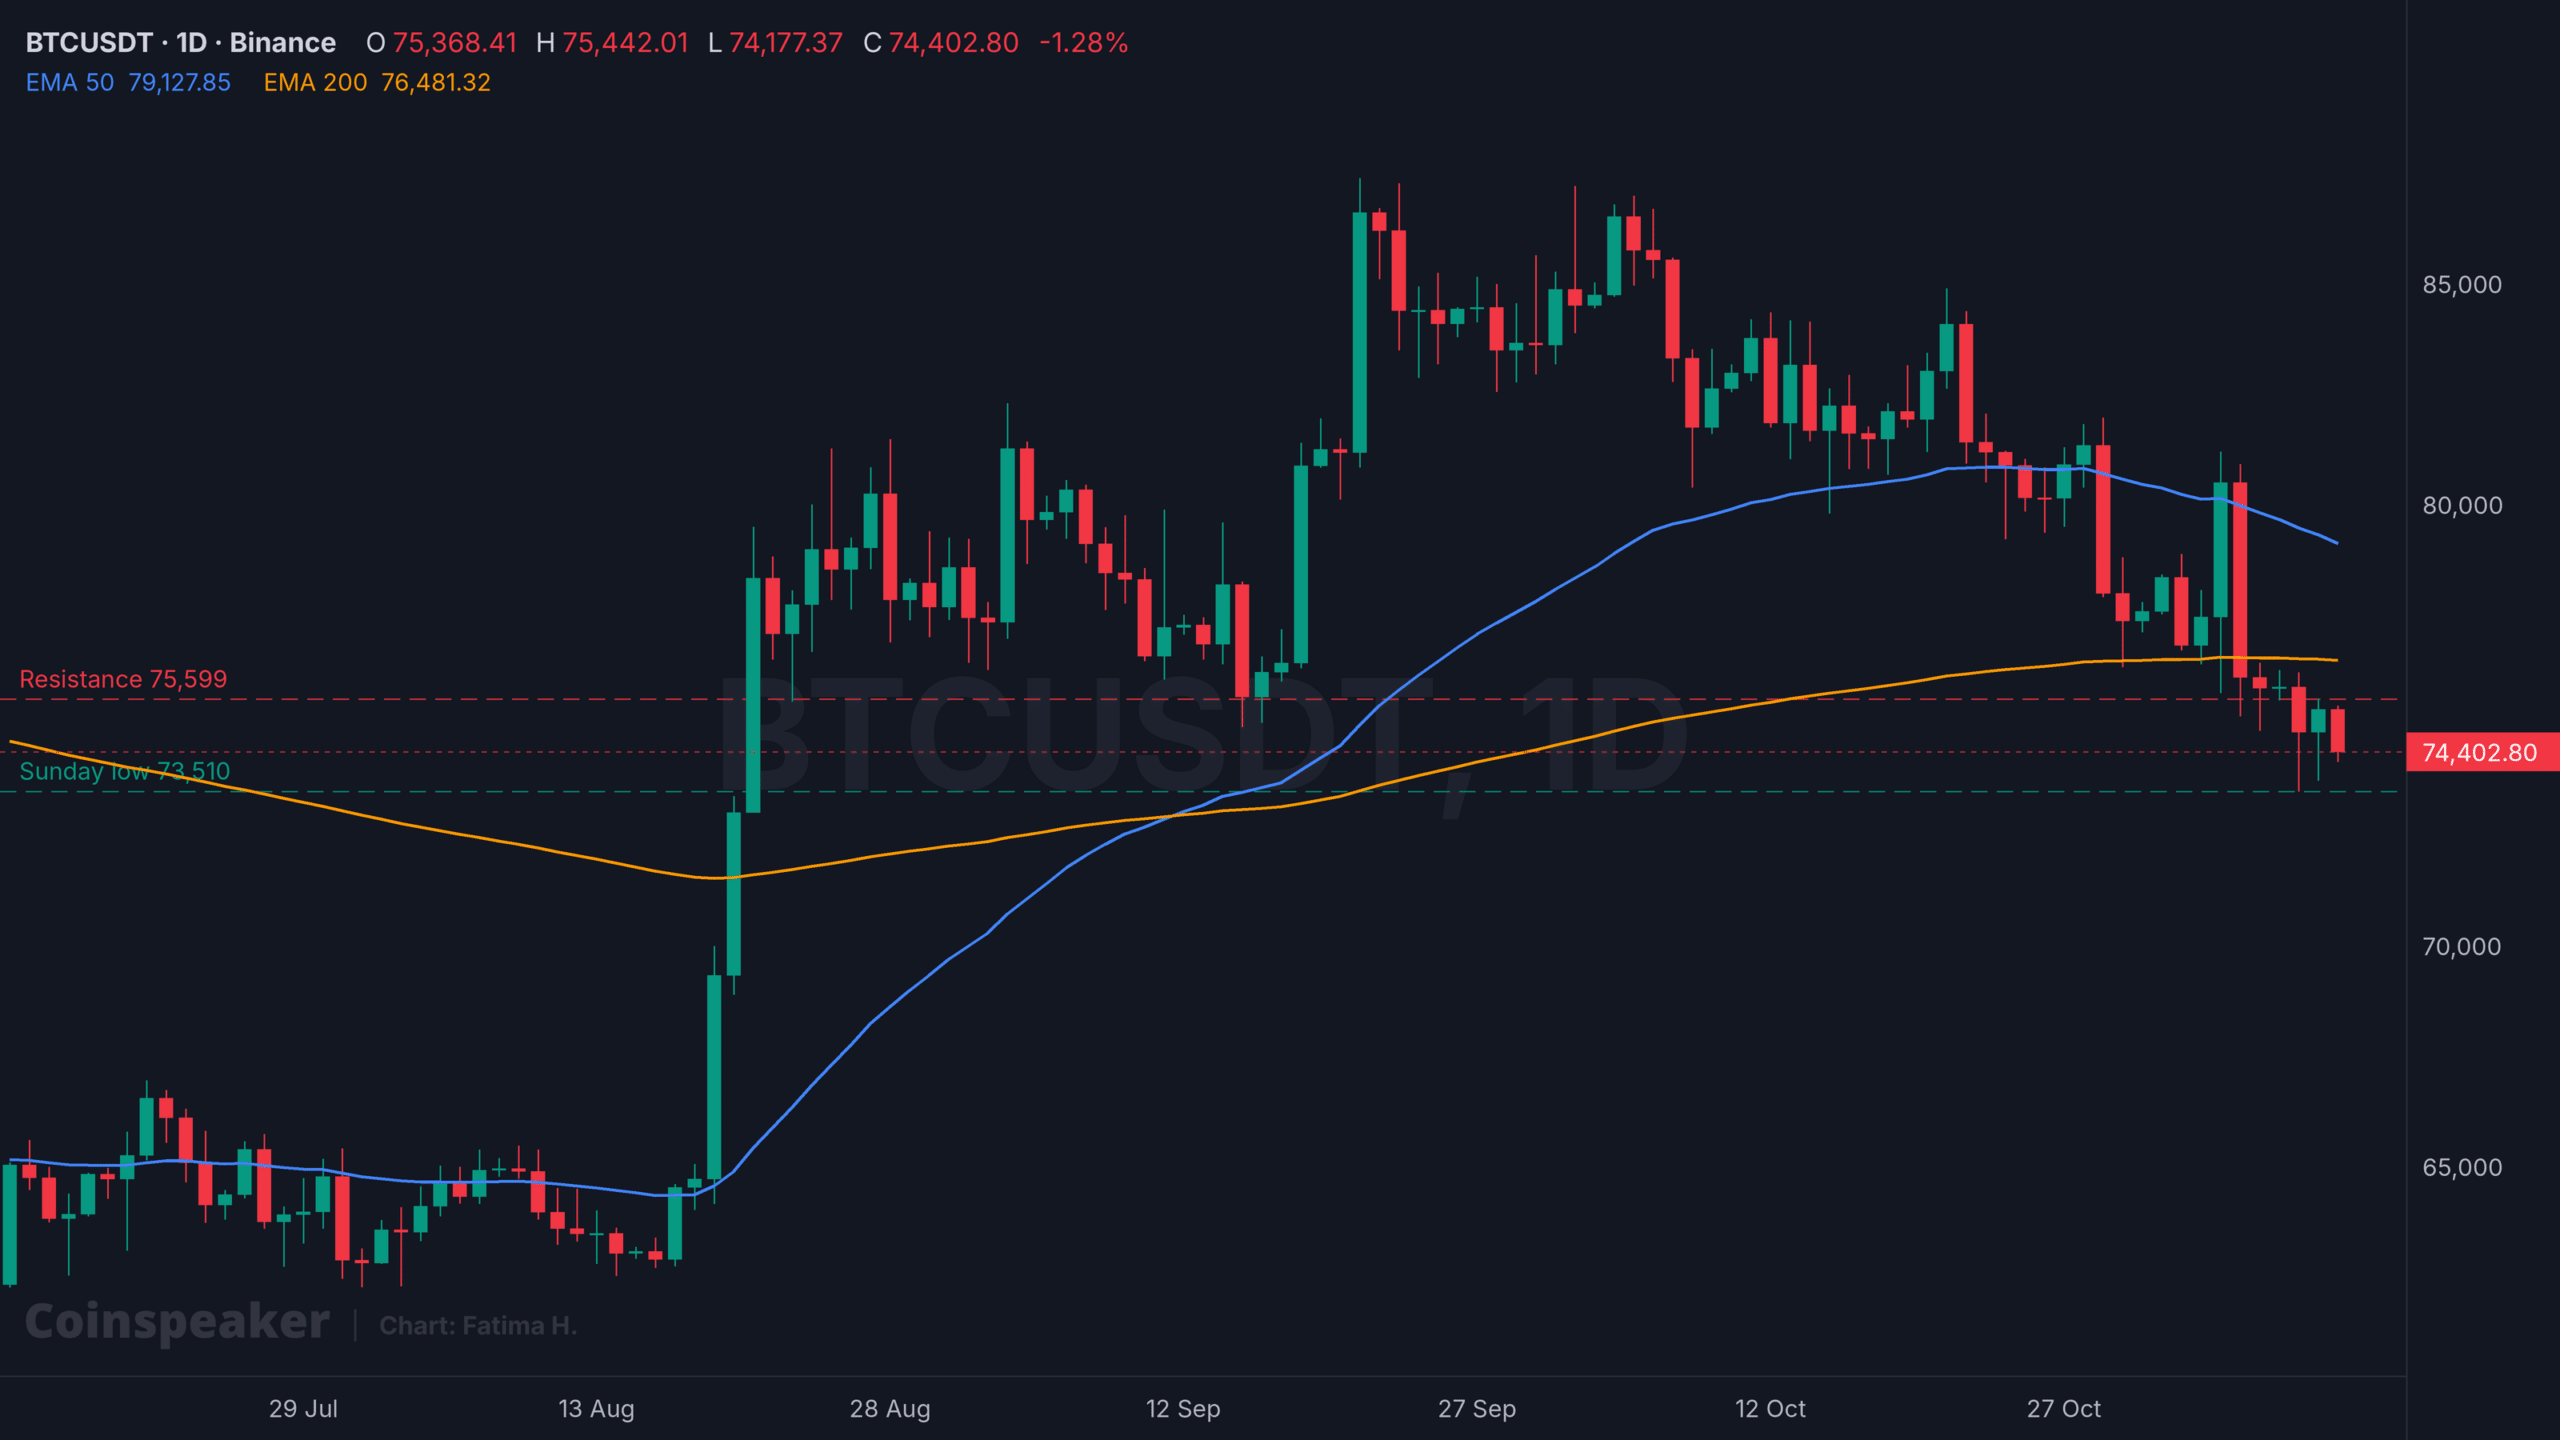
BTCUSDT 1D chart. Source: TradingView.
| CPI outcome | What it could mean | Level to watch |
|---|---|---|
| Core at 0.1% | Lower hike odds; room for a bounce | $75,599, then $76,481 |
| Core at 0.2% | In line; likely range-bound | $73,510 to $75,599 |
| Core at 0.3% or higher | December hike reinforced | $73,510, then $73,027 |
In 20 of the last 24 reports, Bitcoin’s direction over the next 24 hours matched the first-hour move after the CPI release.
Authors credited by the source: Daniel Francis
Published by Holder based on an external source.