Ethereum activity surges to records, ETH price sinks 30% in six months
Ethereum usage hit records in Feb 2026 while price lagged. ETH trades near $2,000 even as activity and staking climb to highs.
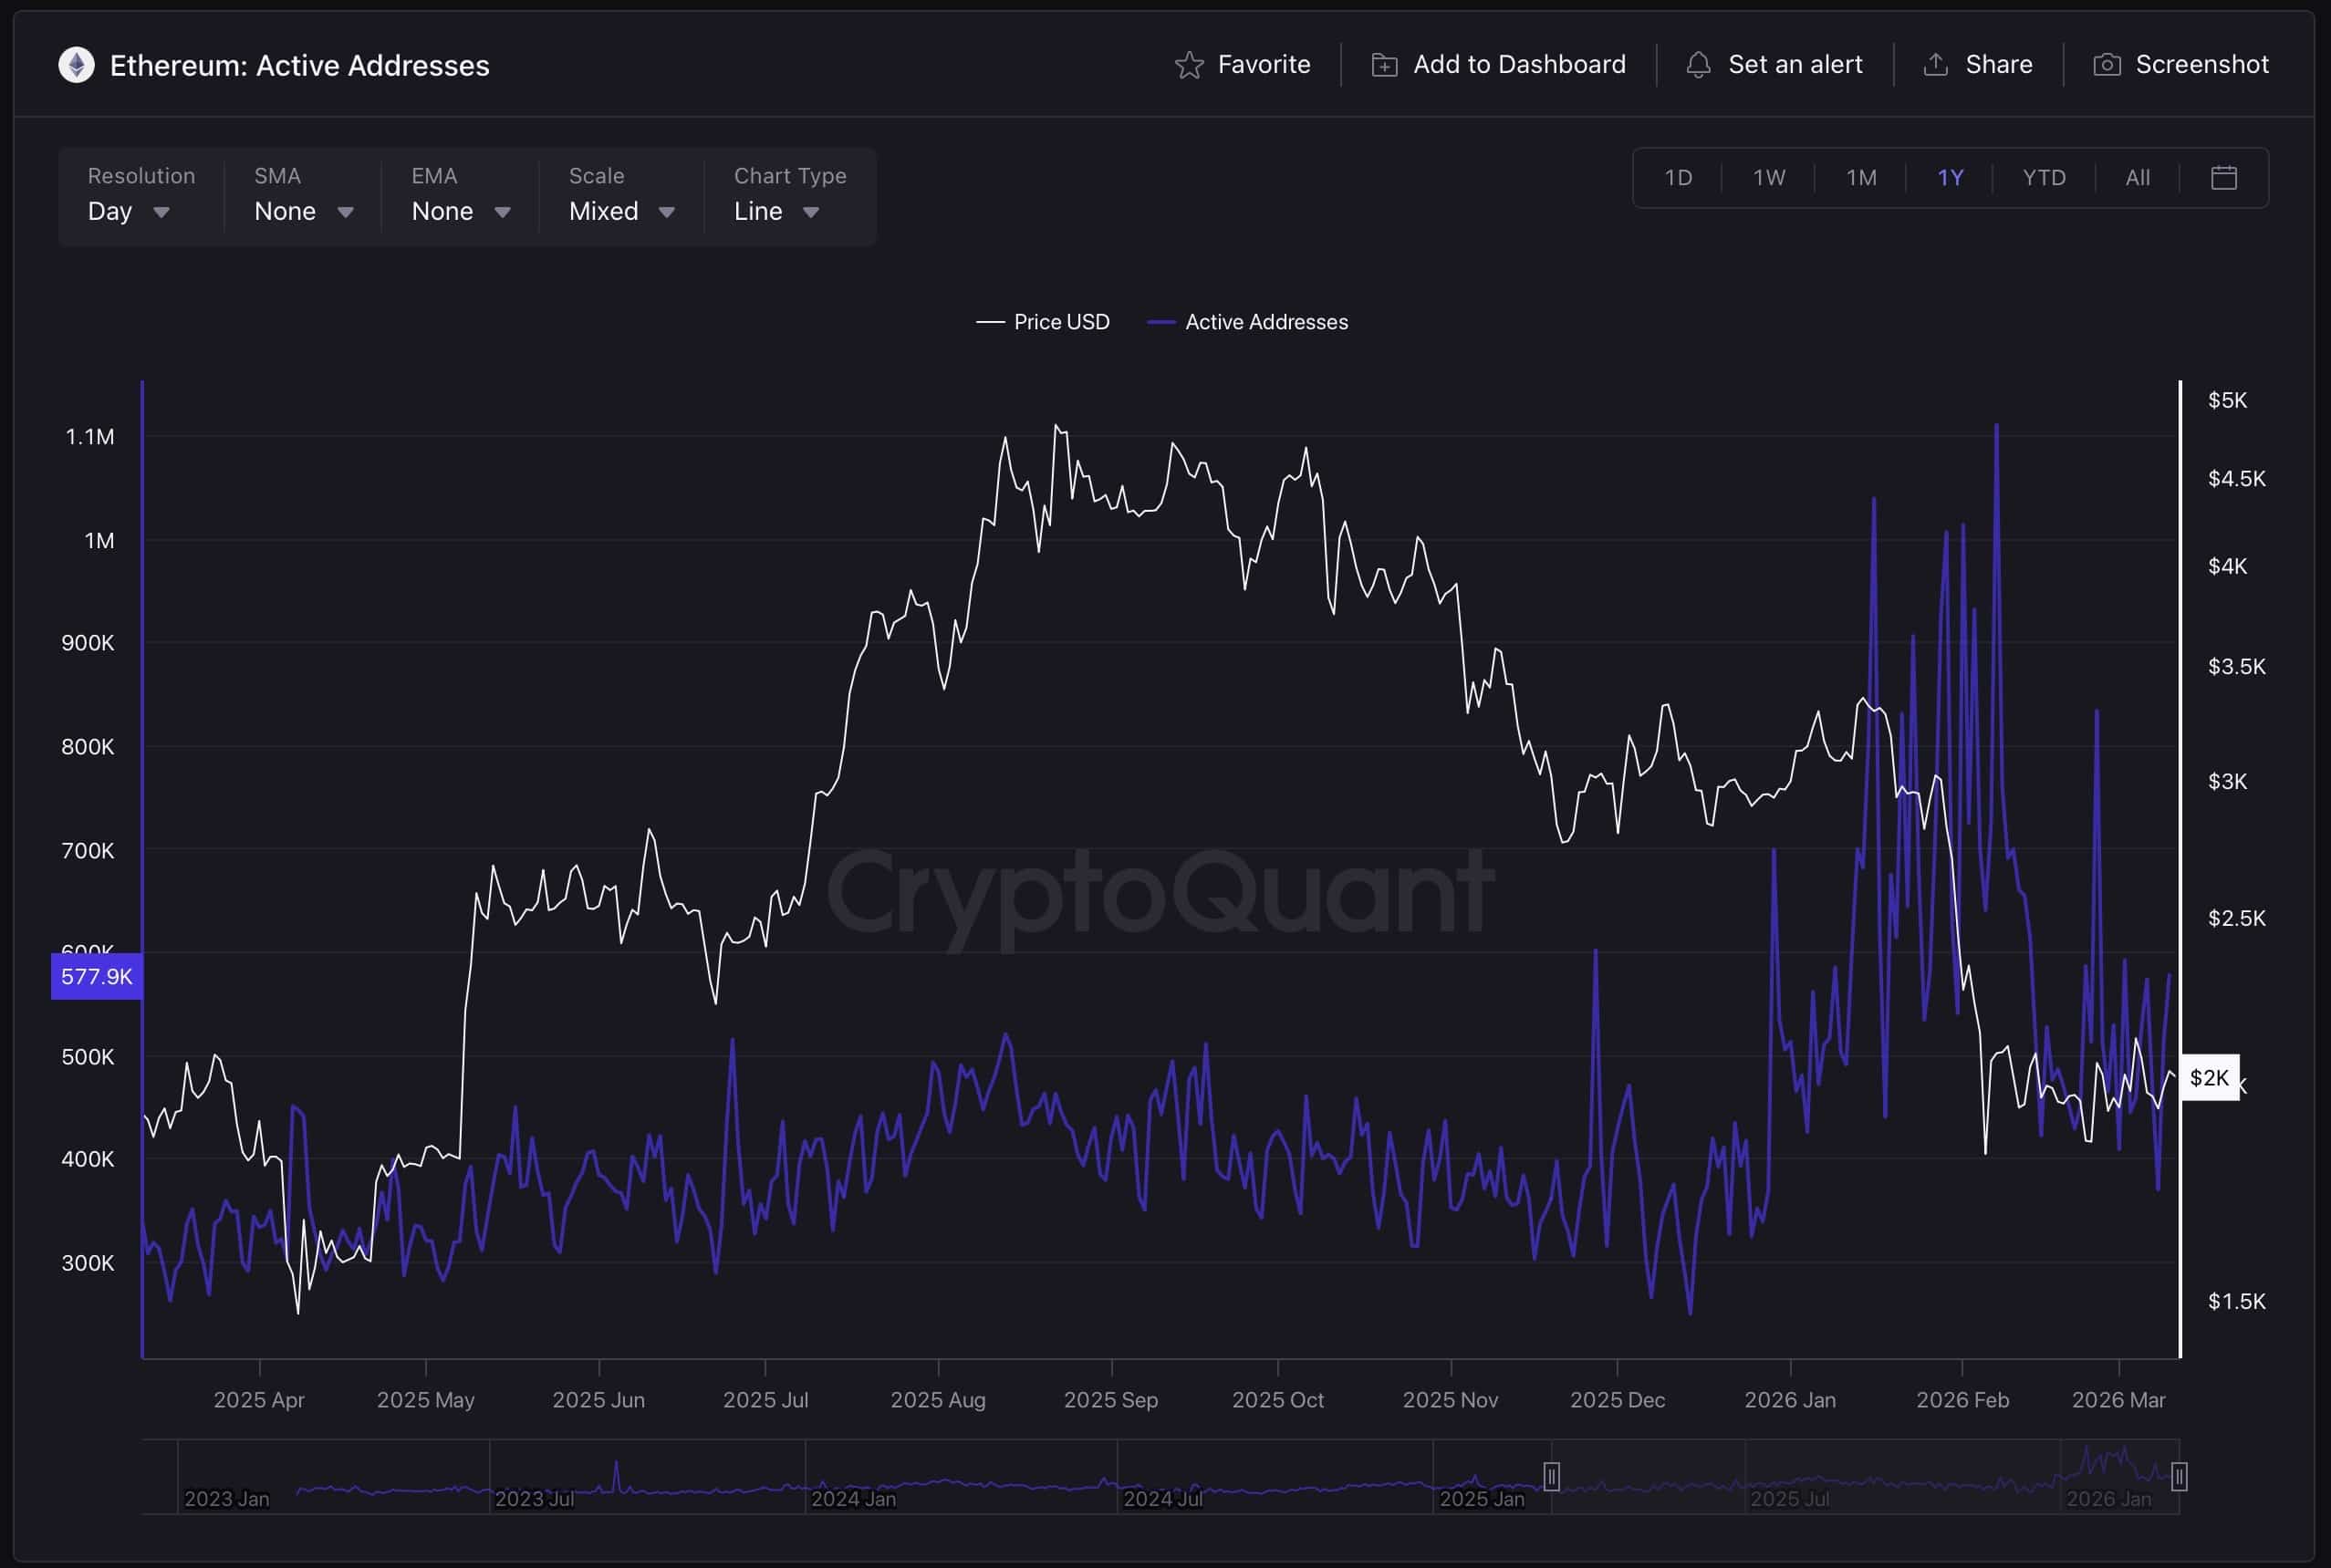
- Daily active addresses surpassed 700,000 in February, per CryptoQuant. The 30-day average reached 837,200, up 82% vs five years and ~1,100% vs a decade, with new wallets at 284,800/day, up 64% vs five years.
- Smart contract calls topped 40 million per day in February. Token transfers via internal contract calls also set records, driven by DeFi, stablecoins, and automated protocols, per CryptoQuant.
- Over 37.7 million ETH is staked, shrinking circulating supply, while liquid staking keeps funds usable. Source: CryptoQuant.
ETH price action diverged from usage.
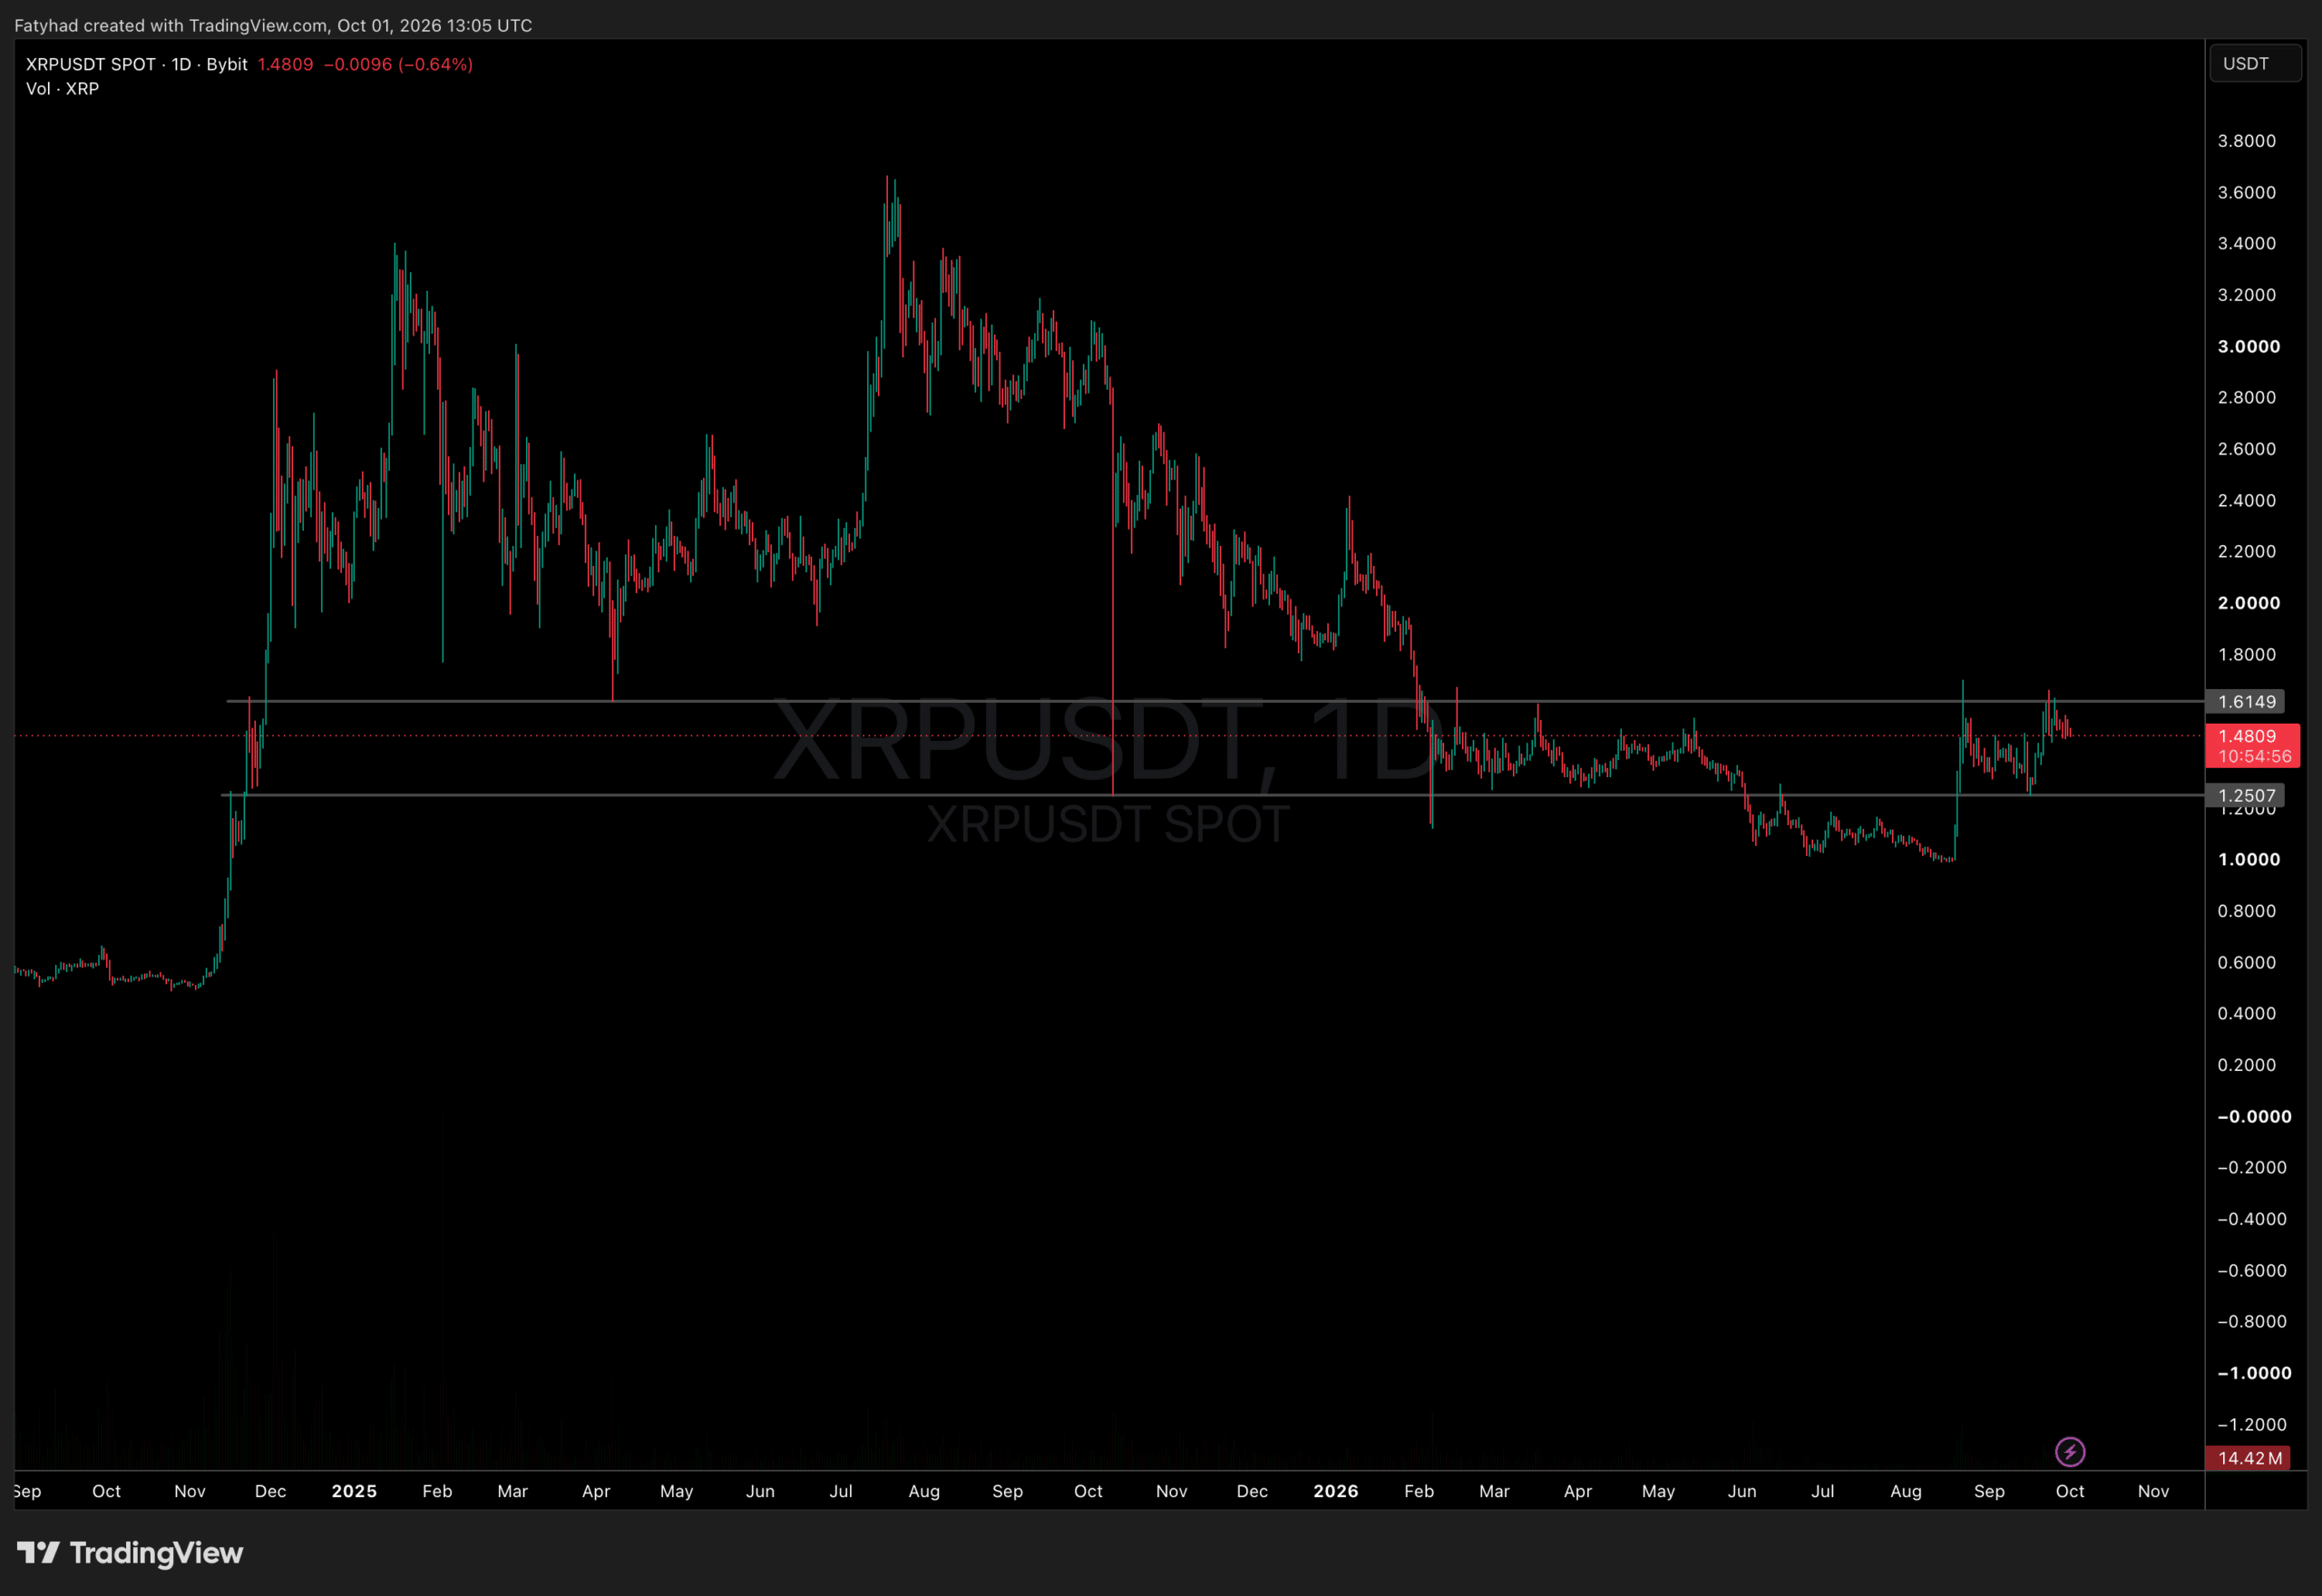
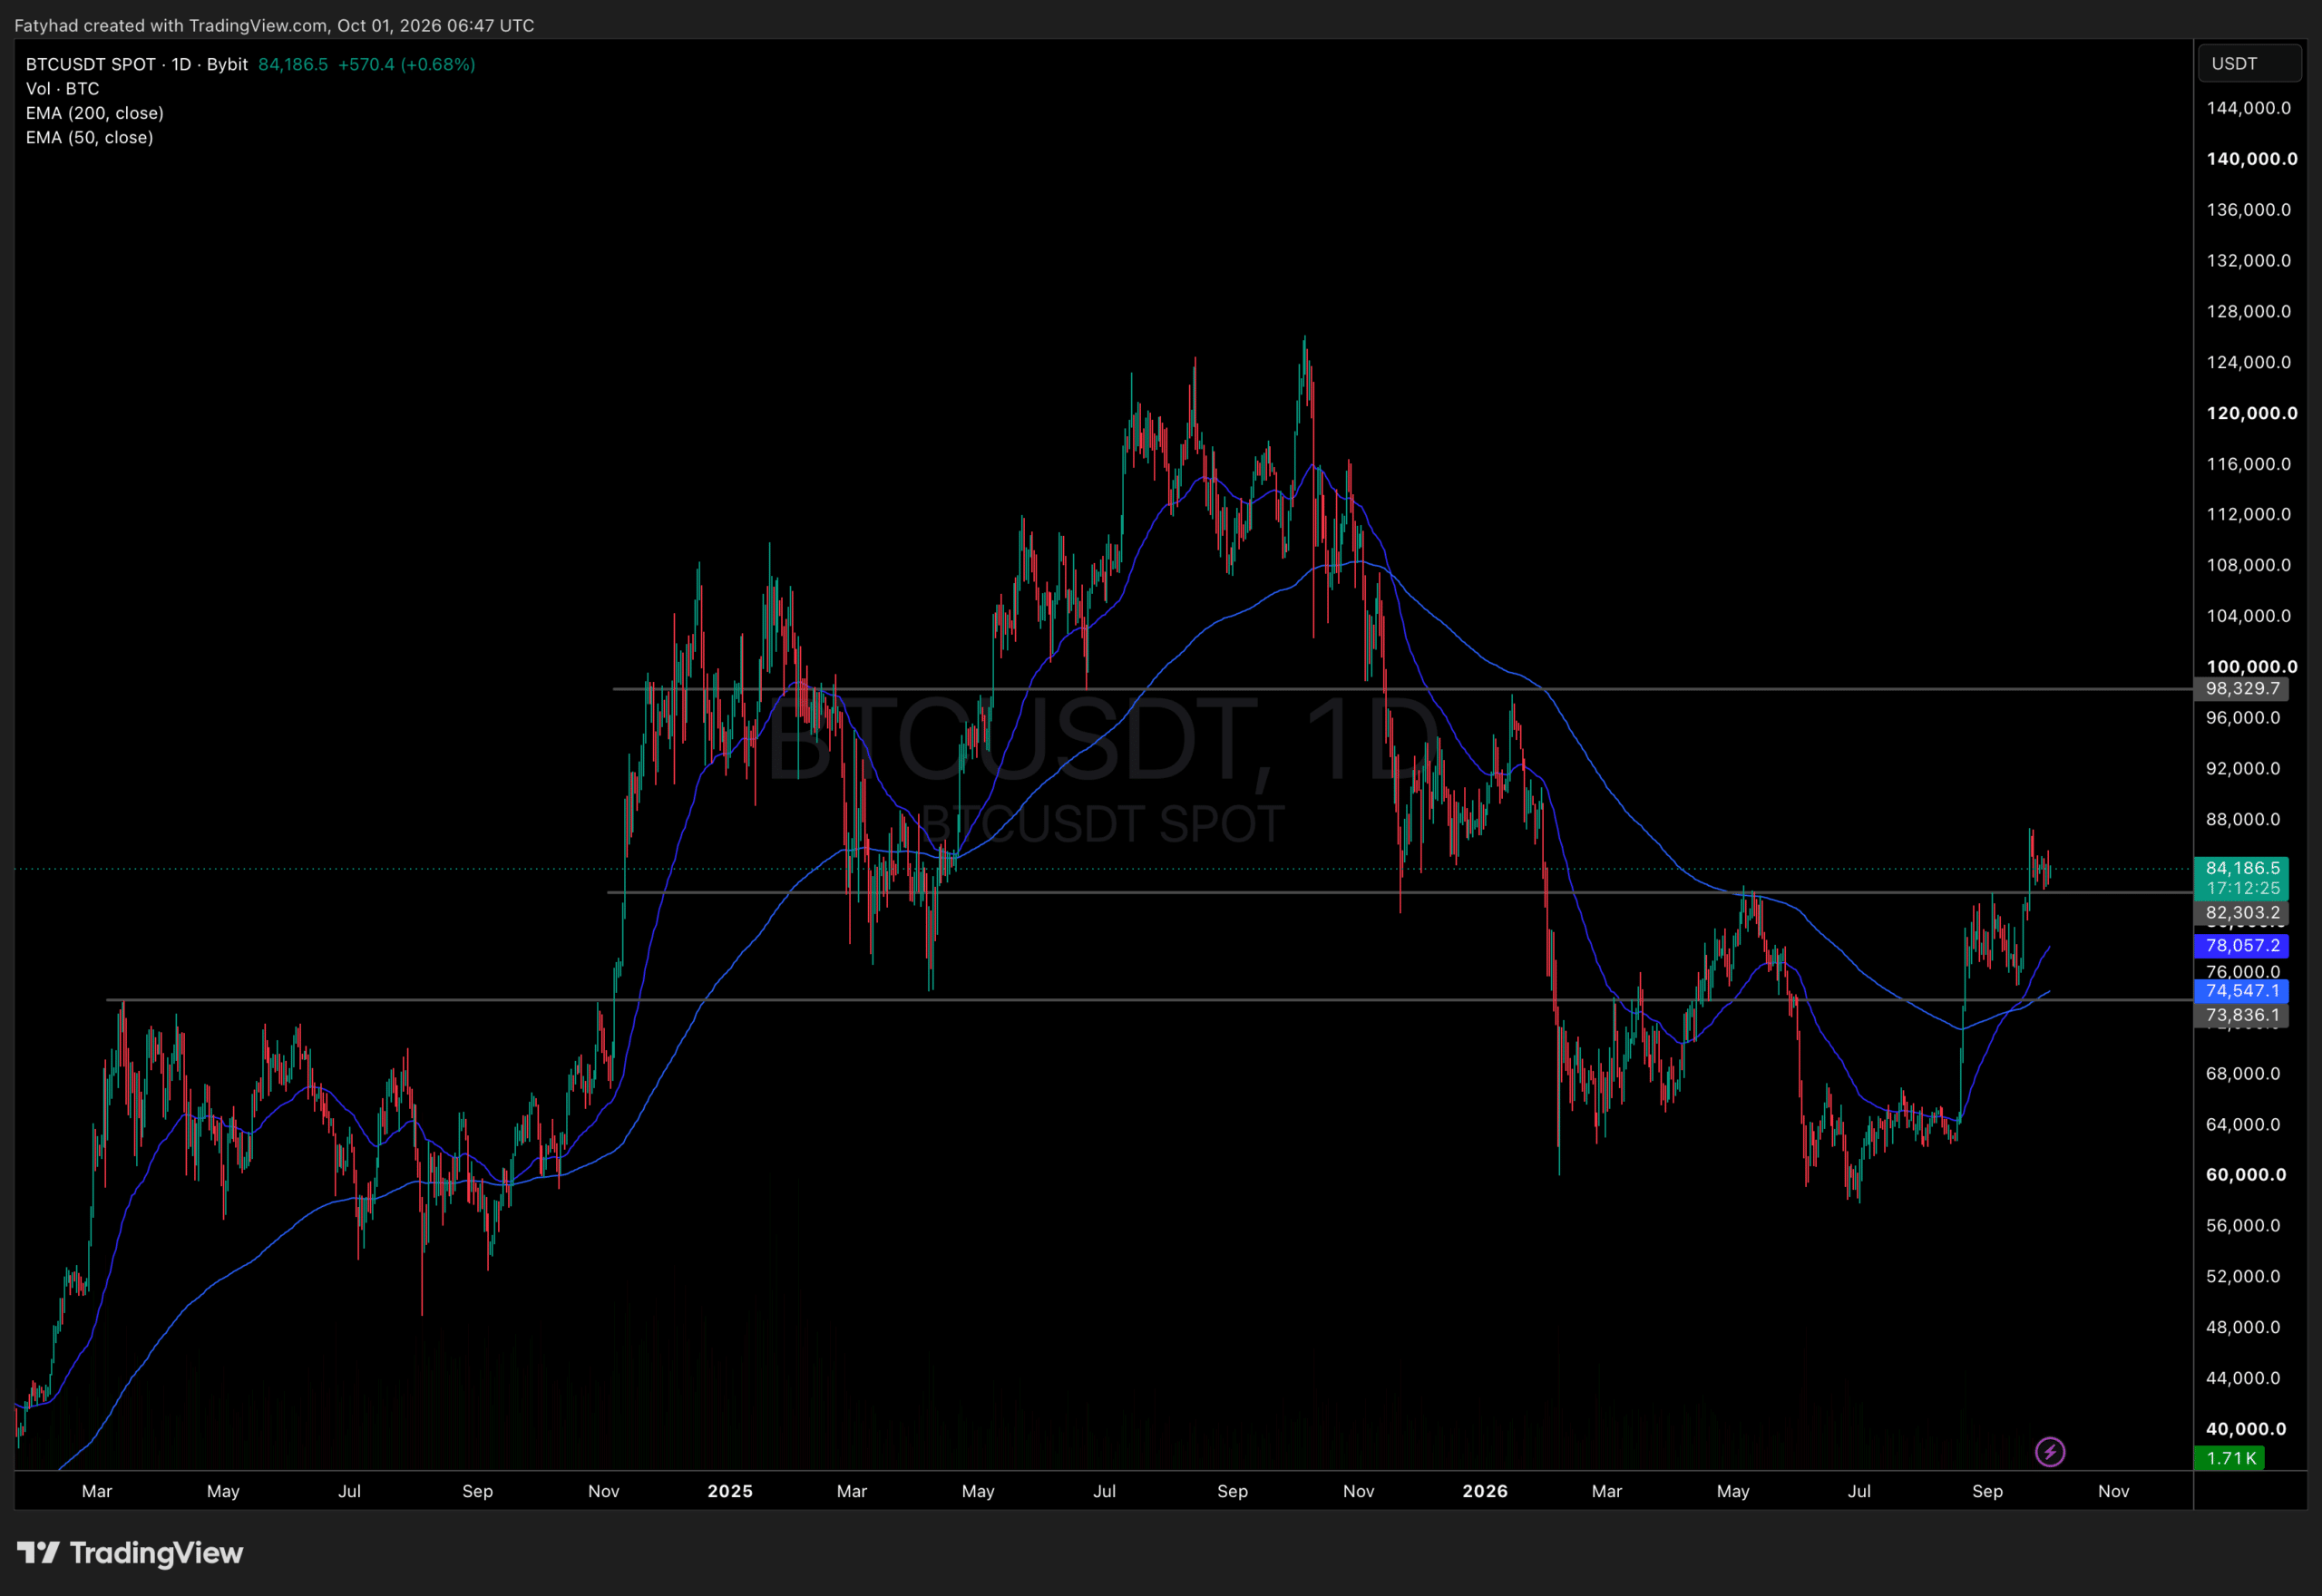
- ETH trades around $2,000 and is down roughly 30% over six months, per the cited TradingView chart.
- The one-year change in realized capitalization turned negative, and ETH moved to trading venues faster than BTC, indicating elevated selling pressure, per CryptoQuant.
- A large whale offloaded substantial ETH during peak activity, adding further pressure. Source: Coinspeaker.
Fees and revenues shifted away from L1.
- In the past 30 days, Ethereum generated about $10.3 million in transaction fees, versus nearly $25 million on Tron and approximately $20 million on Solana, per DefiLlama. The Base L2 generated roughly 3x Ethereum’s protocol revenue over the same period, per the same dataset.
Bottom line for investors: record on-chain usage, heavier exchange supply, weaker fee capture on L1, and whale distribution coexist. The activity–price link that lifted ETH in 2018 and 2021 has materially weakened, per CryptoQuant.