
Hot CPI pushes XRP down to $1.05 as Fed hike looms
XRP fell to $1.0500 within five minutes of the U.S. October CPI release and then rebounded to about $1.07. It traded at $1.0797 when the report hit at 8:30 a.m. New York time, or 13:30 UTC, and reached its lowest level since August 19 by 13:35 UTC. Bitcoin dropped to $73,525 in the same window. The move brings XRP back to a support band it tested twice this year around $1.05.
The CPI print and Fed signaling: implications for XRP
Headline CPI rose 0.4% month over month versus a 0.3% consensus. Core CPI rose 0.3% versus 0.2% expected and has run about 0.3% for three consecutive months. The Bureau of Labor Statistics did not publish a year-over-year rate because it lacked October 2025 prices during the government shutdown, leaving monthly figures to drive the report.
Federal Reserve Governor Christopher Waller said in a speech he leans toward a 0.25 percentage point hike in December and that a 0.5-point hike should be considered if core CPI prints around 0.3%. The print matched 0.3%. Market pricing before the release implied almost no chance of a 0.5-point hike. Higher policy rates increase yields on cash and bonds and typically pressure risk assets like XRP.
BREAKING: October CPI inflation rises +0.4% month-over-month, above expectations of +0.3%.
Core CPI inflation rose +0.3%, also above expectations of +0.2%.
BLS will not be releasing year-over-year figures due to the October 2025 government shutdown.
Inflation still appears to…
— The Kobeissi Letter (@KobeissiLetter) November 10, 2026
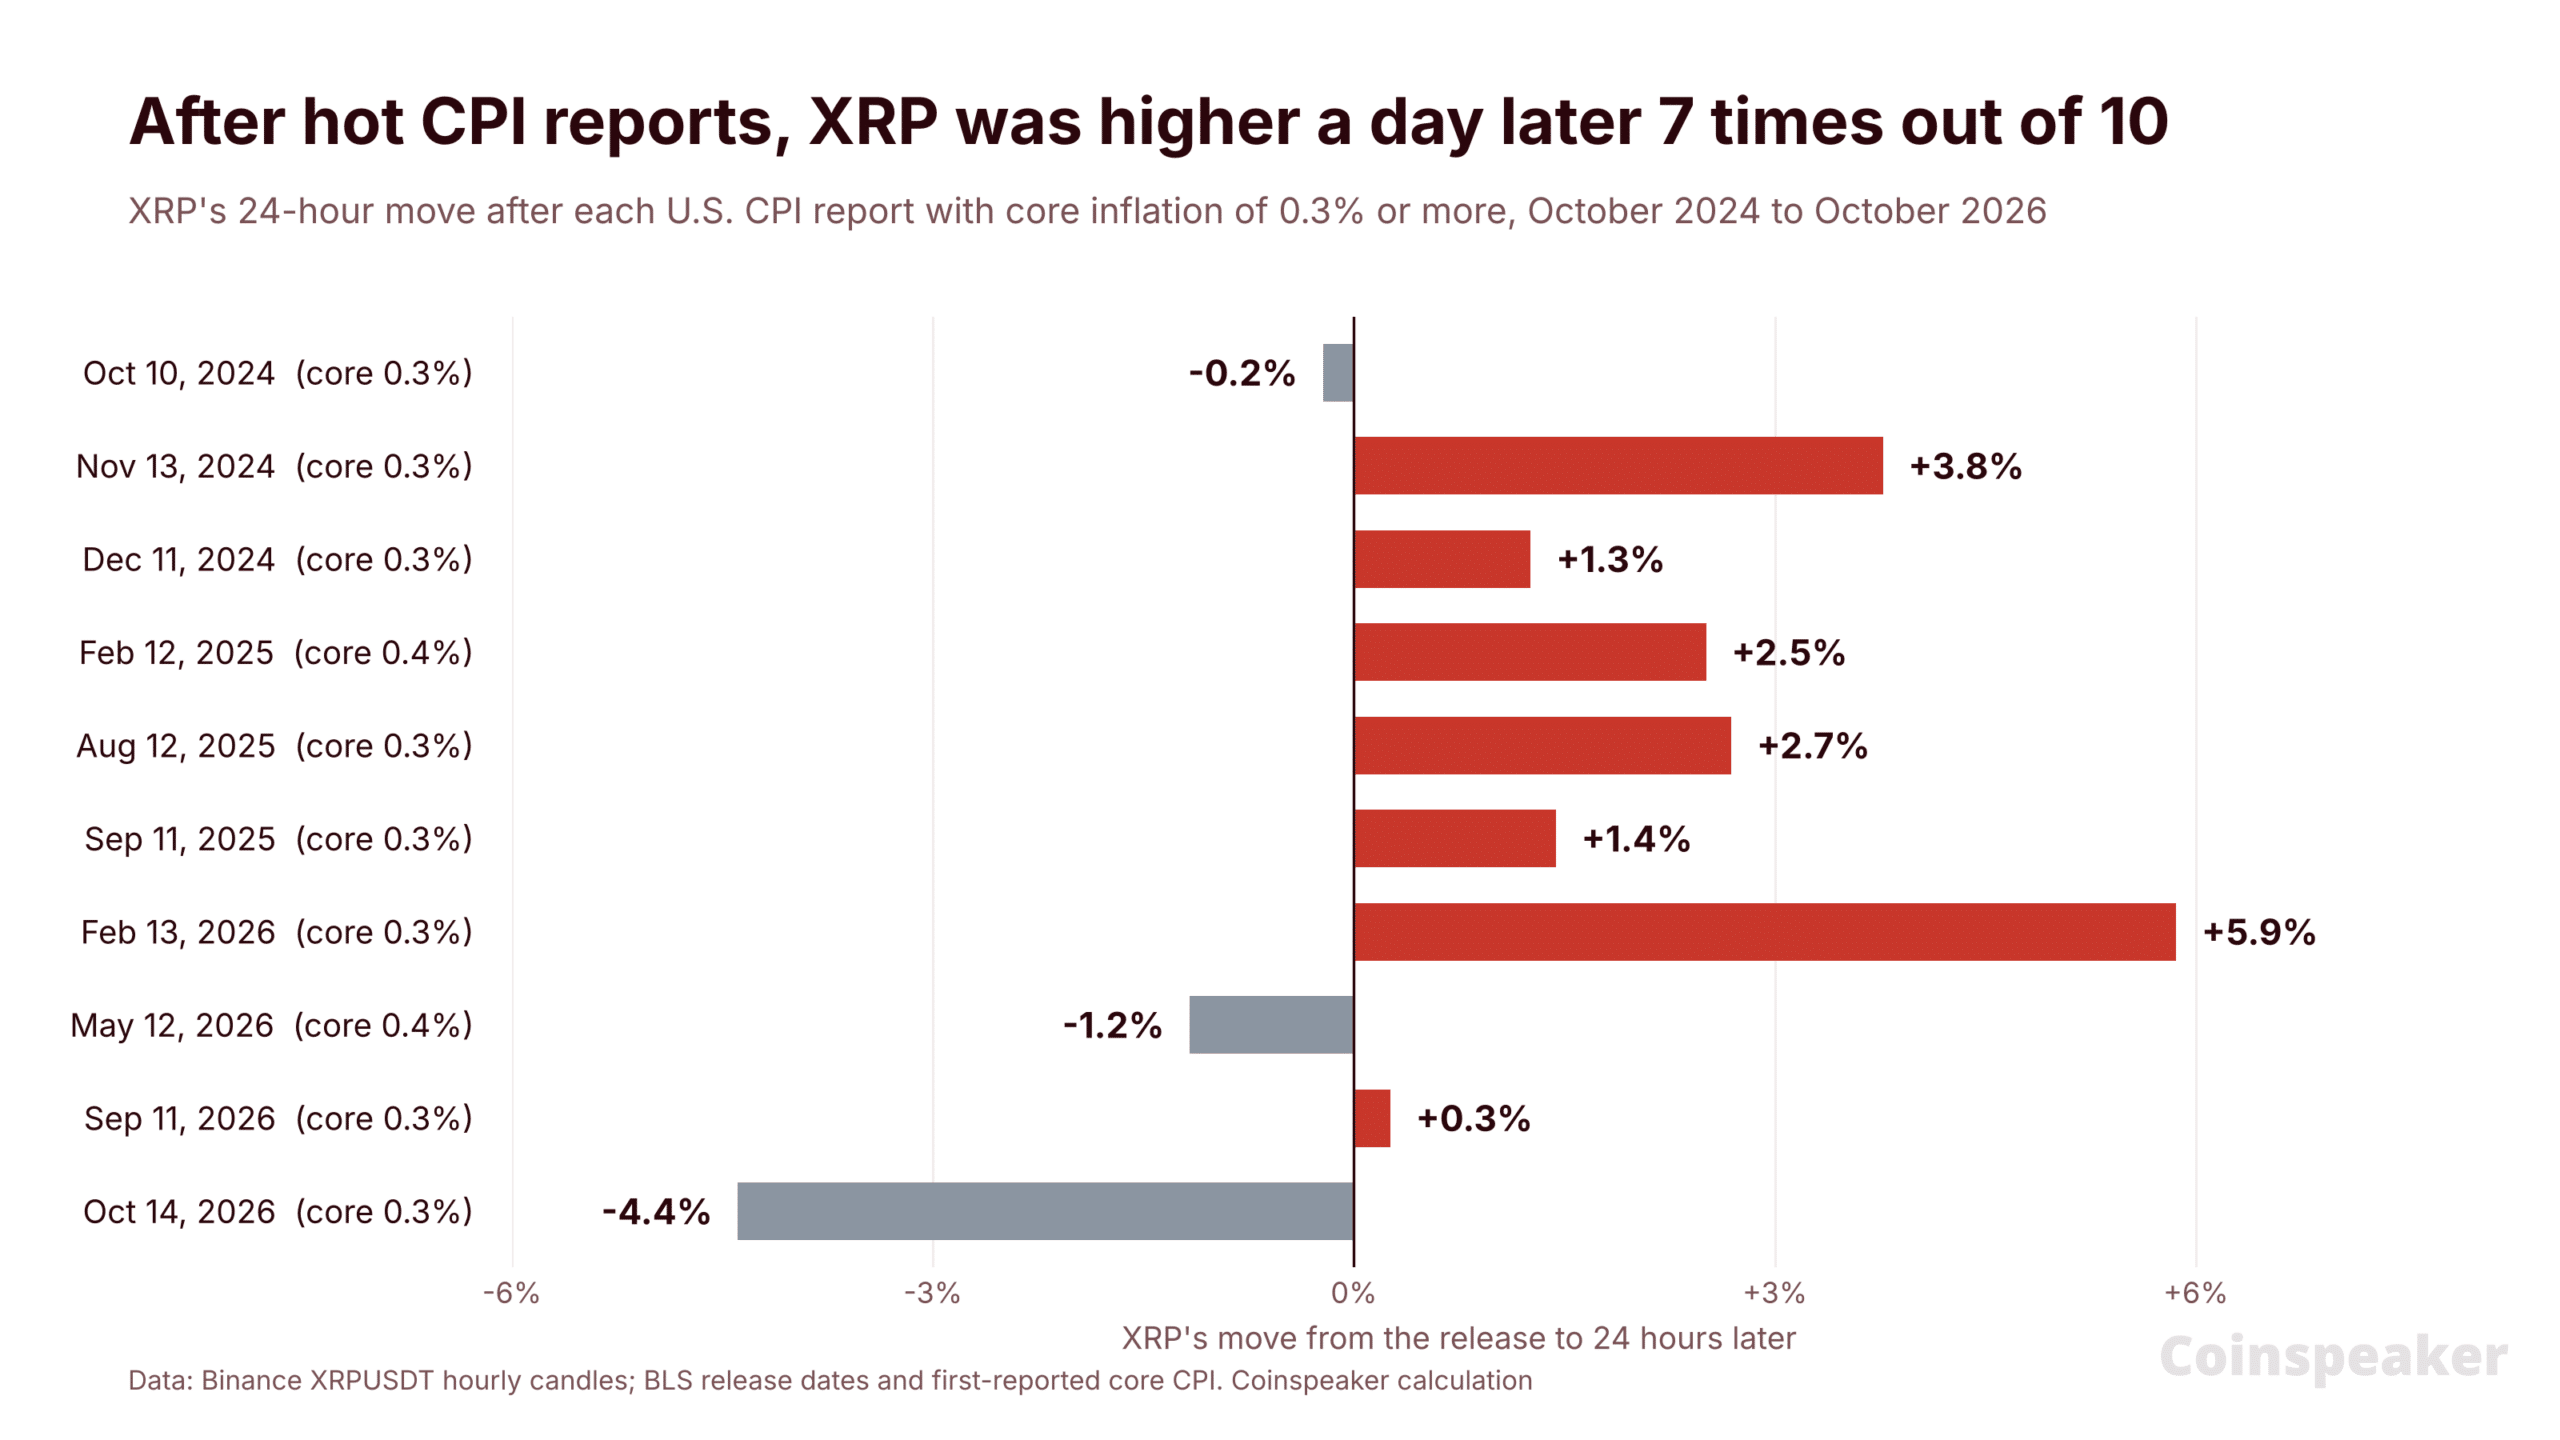
XRP’s post-CPI pattern: short-term reactions to hot prints
Assessment: 24 CPI reports from October 2024 through October 2026. Ten reports had core CPI at or above 0.3%. In seven of those ten, XRP traded higher 24 hours later. Median move: +1.4%. Performance in 2026 was weaker. Of four hot prints this year, XRP rose twice and fell twice; after the October 14 release it fell 4.4% in the next 24 hours.
The difference this time: a hot print that elevates the odds of a larger Fed hike provides more downside catalysts than a print that only confirms a smaller move.
$1.05 support: record of holds and breaks
- Late June to early July: Range $1.02 to $1.07 for about a week. Intraday low $1.022 on July 1 followed by a rebound above $1.11 on July 2. Support held.
- Early August: Close at $1.035 on August 6 followed by a decline to $0.986 on August 14, the last break below $1, then a rebound above $1.10 on August 19. Support broke.
Today’s $1.0500 low aligns with this zone. First tests often hold. Subsequent tests typically see fewer resting bids.
XRP price analysis: can $1.05 hold?
Spot: about $1.07 on Binance after the CPI move. Change: down 2.8% in 24 hours, down 17% in a week. Drawdown: 71% below the July 2025 high of $3.65. Technicals: price sits below the 50-day EMA at $1.294 and the 200-day EMA at $1.350.
- Resistance: $1.130, then $1.165, then the 50-day EMA at $1.294.
- Support: $1.050, then $1.022, then $0.986.
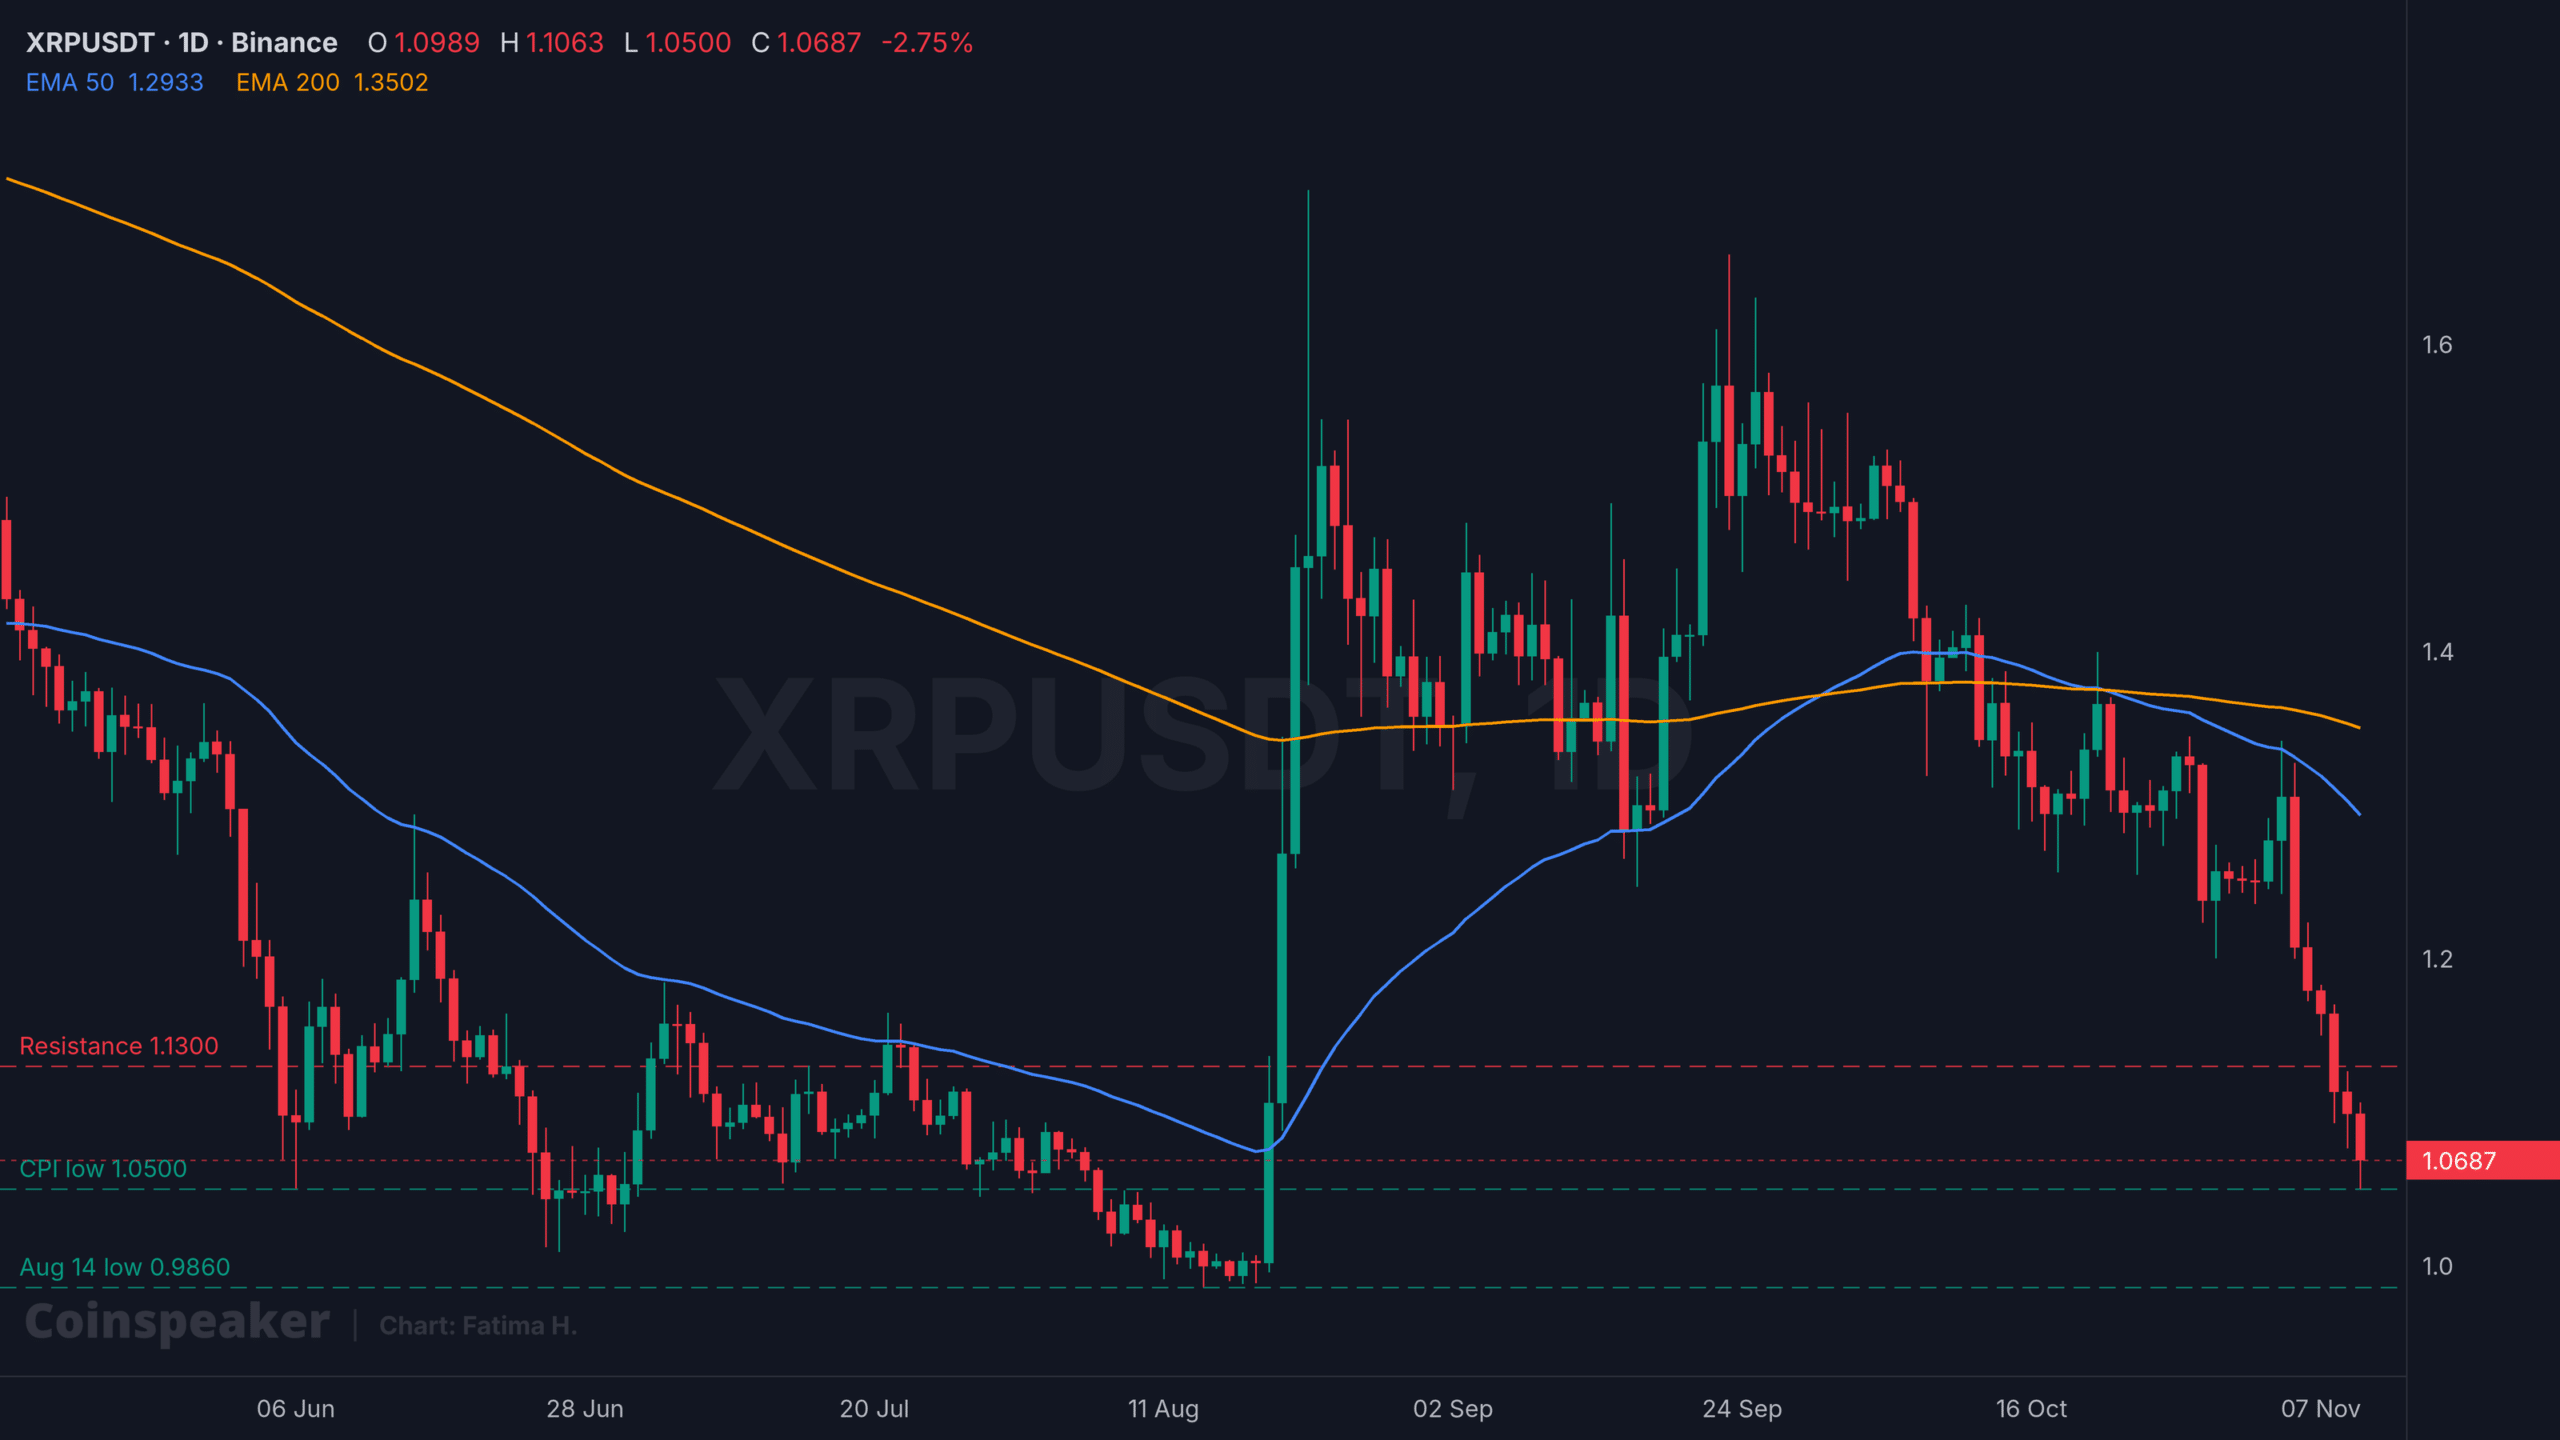
XRPUSDT 1D chart. Source: Binance.
| Path | What has to happen | Next stop |
|---|---|---|
| Bounce | A daily close above $1.130 | $1.165, then the 50-day EMA at $1.294 |
| Hold the floor | Price remains between $1.050 and $1.130 | Base-building similar to late June |
| Break down | A daily close below $1.050 | $1.022, then $0.986 |
Status: the first test of $1.05 has held intraday. Decision level: a daily close above $1.05 preserves support; a daily close below opens the path toward $1.02 and $0.986.
Authors credited by the source: Daniel Francis
Published by Holder based on an external source.