
Inflation report lifts Fed hike odds, Bitcoin falls below $73K, ZEC leads
Crypto prices fell after a hotter-than-expected U.S. inflation print shifted Federal Reserve expectations toward tighter policy. Risk assets sold off, bond yields rose, and leveraged positions amplified declines. Zcash (ZEC) led losses due to prior outperformance and concentrated leveraged longs nearing liquidation.
Macro driver: CPI surprise and Fed repricing
October CPI: headline +0.4% vs +0.3% expected. Core CPI: +0.3% vs +0.2% expected. Fed Governor Christopher Waller said core inflation near 0.3% would put a 50 bps December hike on the table, which increased the market-implied probability of a larger hike. On Polymarket, odds for a ≥50 bps December hike rose from 4.4% pre-release to 12.8% two hours later, now 9.4%. A 25 bps hike is priced at 85.5%. The 10-year U.S. Treasury yield climbed from 4.86% to 4.98%, raising the opportunity cost of holding risk assets.
Additional pressures
- Nvidia: shares fell 5.5% to $168.89, the lowest close since March 30. Crypto often correlates with large-cap AI momentum.
- ETF outflows: U.S. spot Bitcoin ETFs saw a net $969 million out over the last five trading days, per CryptoQuant data summarized by Lookonchain.
Market snapshot
Bitcoin dipped to $72,727 on Binance, now about $73,800. Ether briefly hit $2,006. XRP and Solana fell 2% to 3% over 24 hours. Crypto Fear & Greed Index: 29.
ZEC underperforms: prior gains and leverage
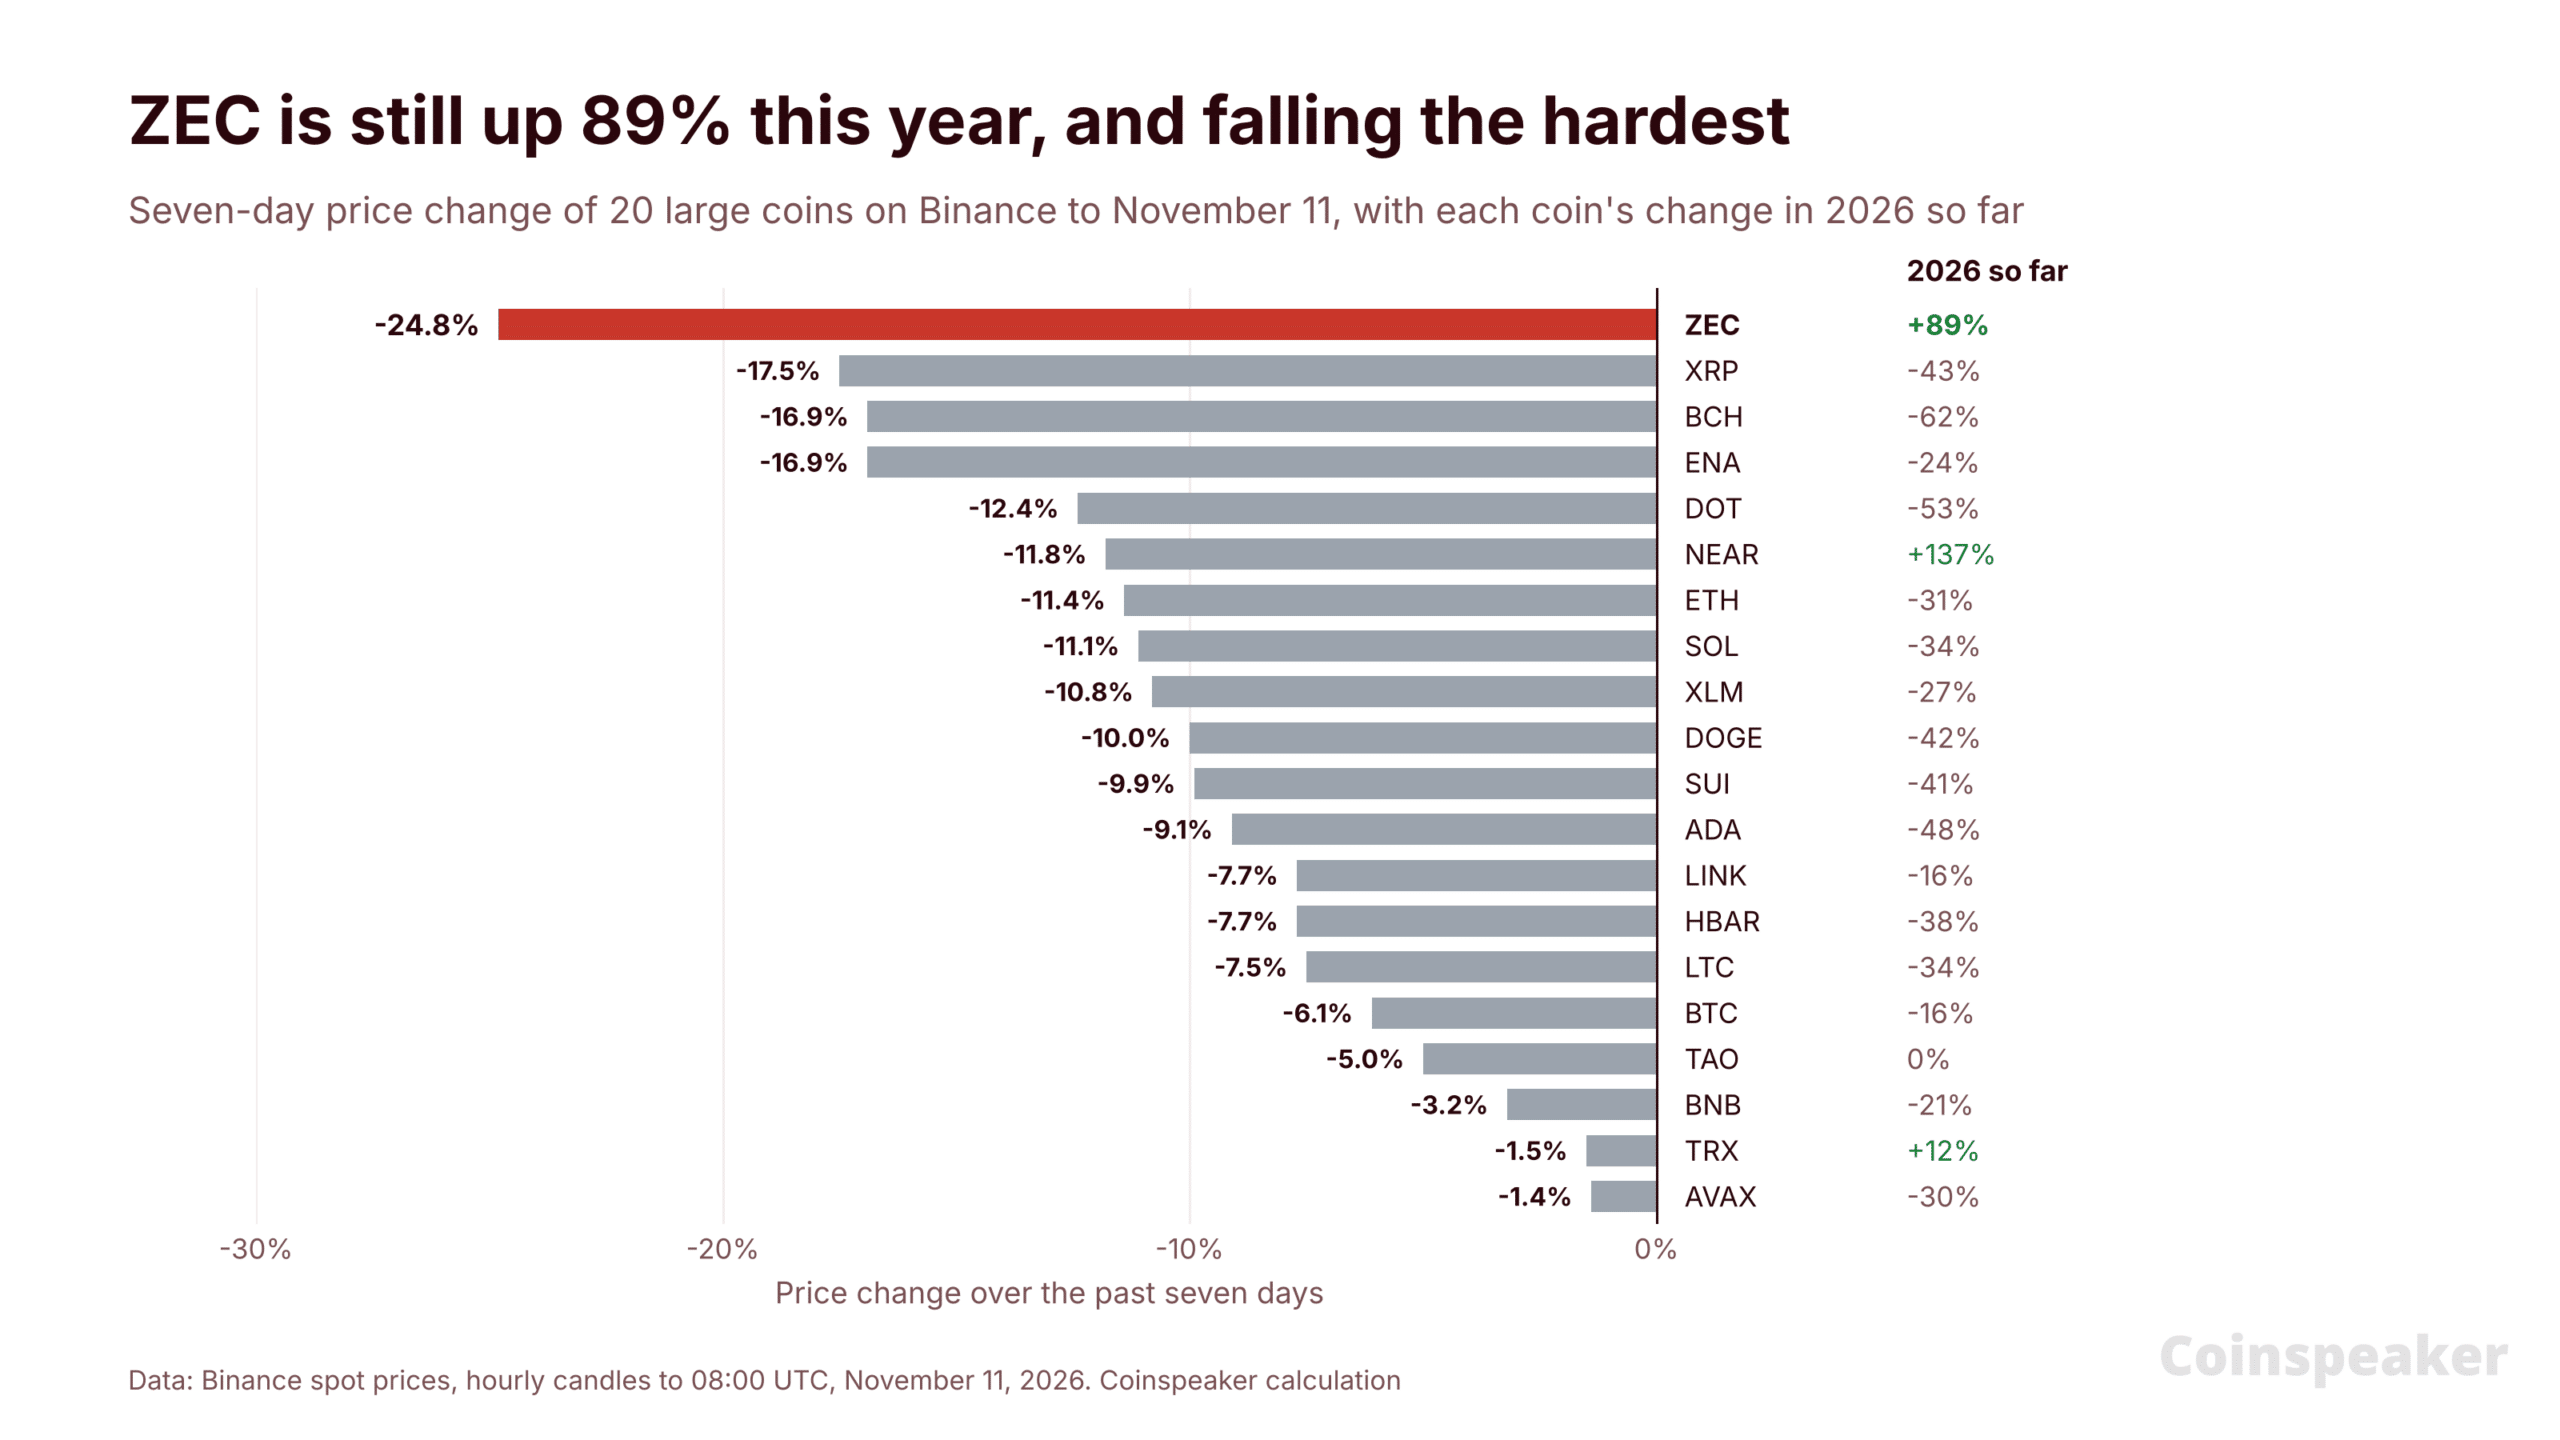
ZEC fell below $1,000 for the first time since September 5, now about $966, down 15.4% in 24 hours and 24.8% in a week. Despite the pullback, ZEC remains up 89% in 2026 after rising from ~$526 on January 1 to a $1,653 close on September 26. Among 20 large Binance-listed coins reviewed, ZEC fell the most over the day and week.
Leverage accelerated the decline. On Hyperliquid, ZEC fell from $1,199.20 to $965.79 in under a day. Lookonchain identified 32 traders with >$1 million each in ZEC longs; 27 are in loss with ~$23.7 million in aggregate paper losses. A highlighted 10x long on 18,000 ZEC ($17.63 million) faces liquidation at $895.46.
Historical volatility: since January 2025, ZEC posted ≥12% single-day drops 14 times on Binance. Seven days later, it recovered in 8 instances, with a median gain of 6.5%.
Technical levels: ZEC and BTC
ZEC trades near $966, having touched $961.07, the lowest since September 4. It sits below the 50-day EMA at $1,200.68 and above the 200-day EMA at $872.23.
- Resistance: $1,050 intraday high; then $1,191.76 near the 50-day EMA.
- Support: $933.12 September 4 low; ~$895 where large Hyperliquid longs face liquidation; then 200-day EMA at $872.23.
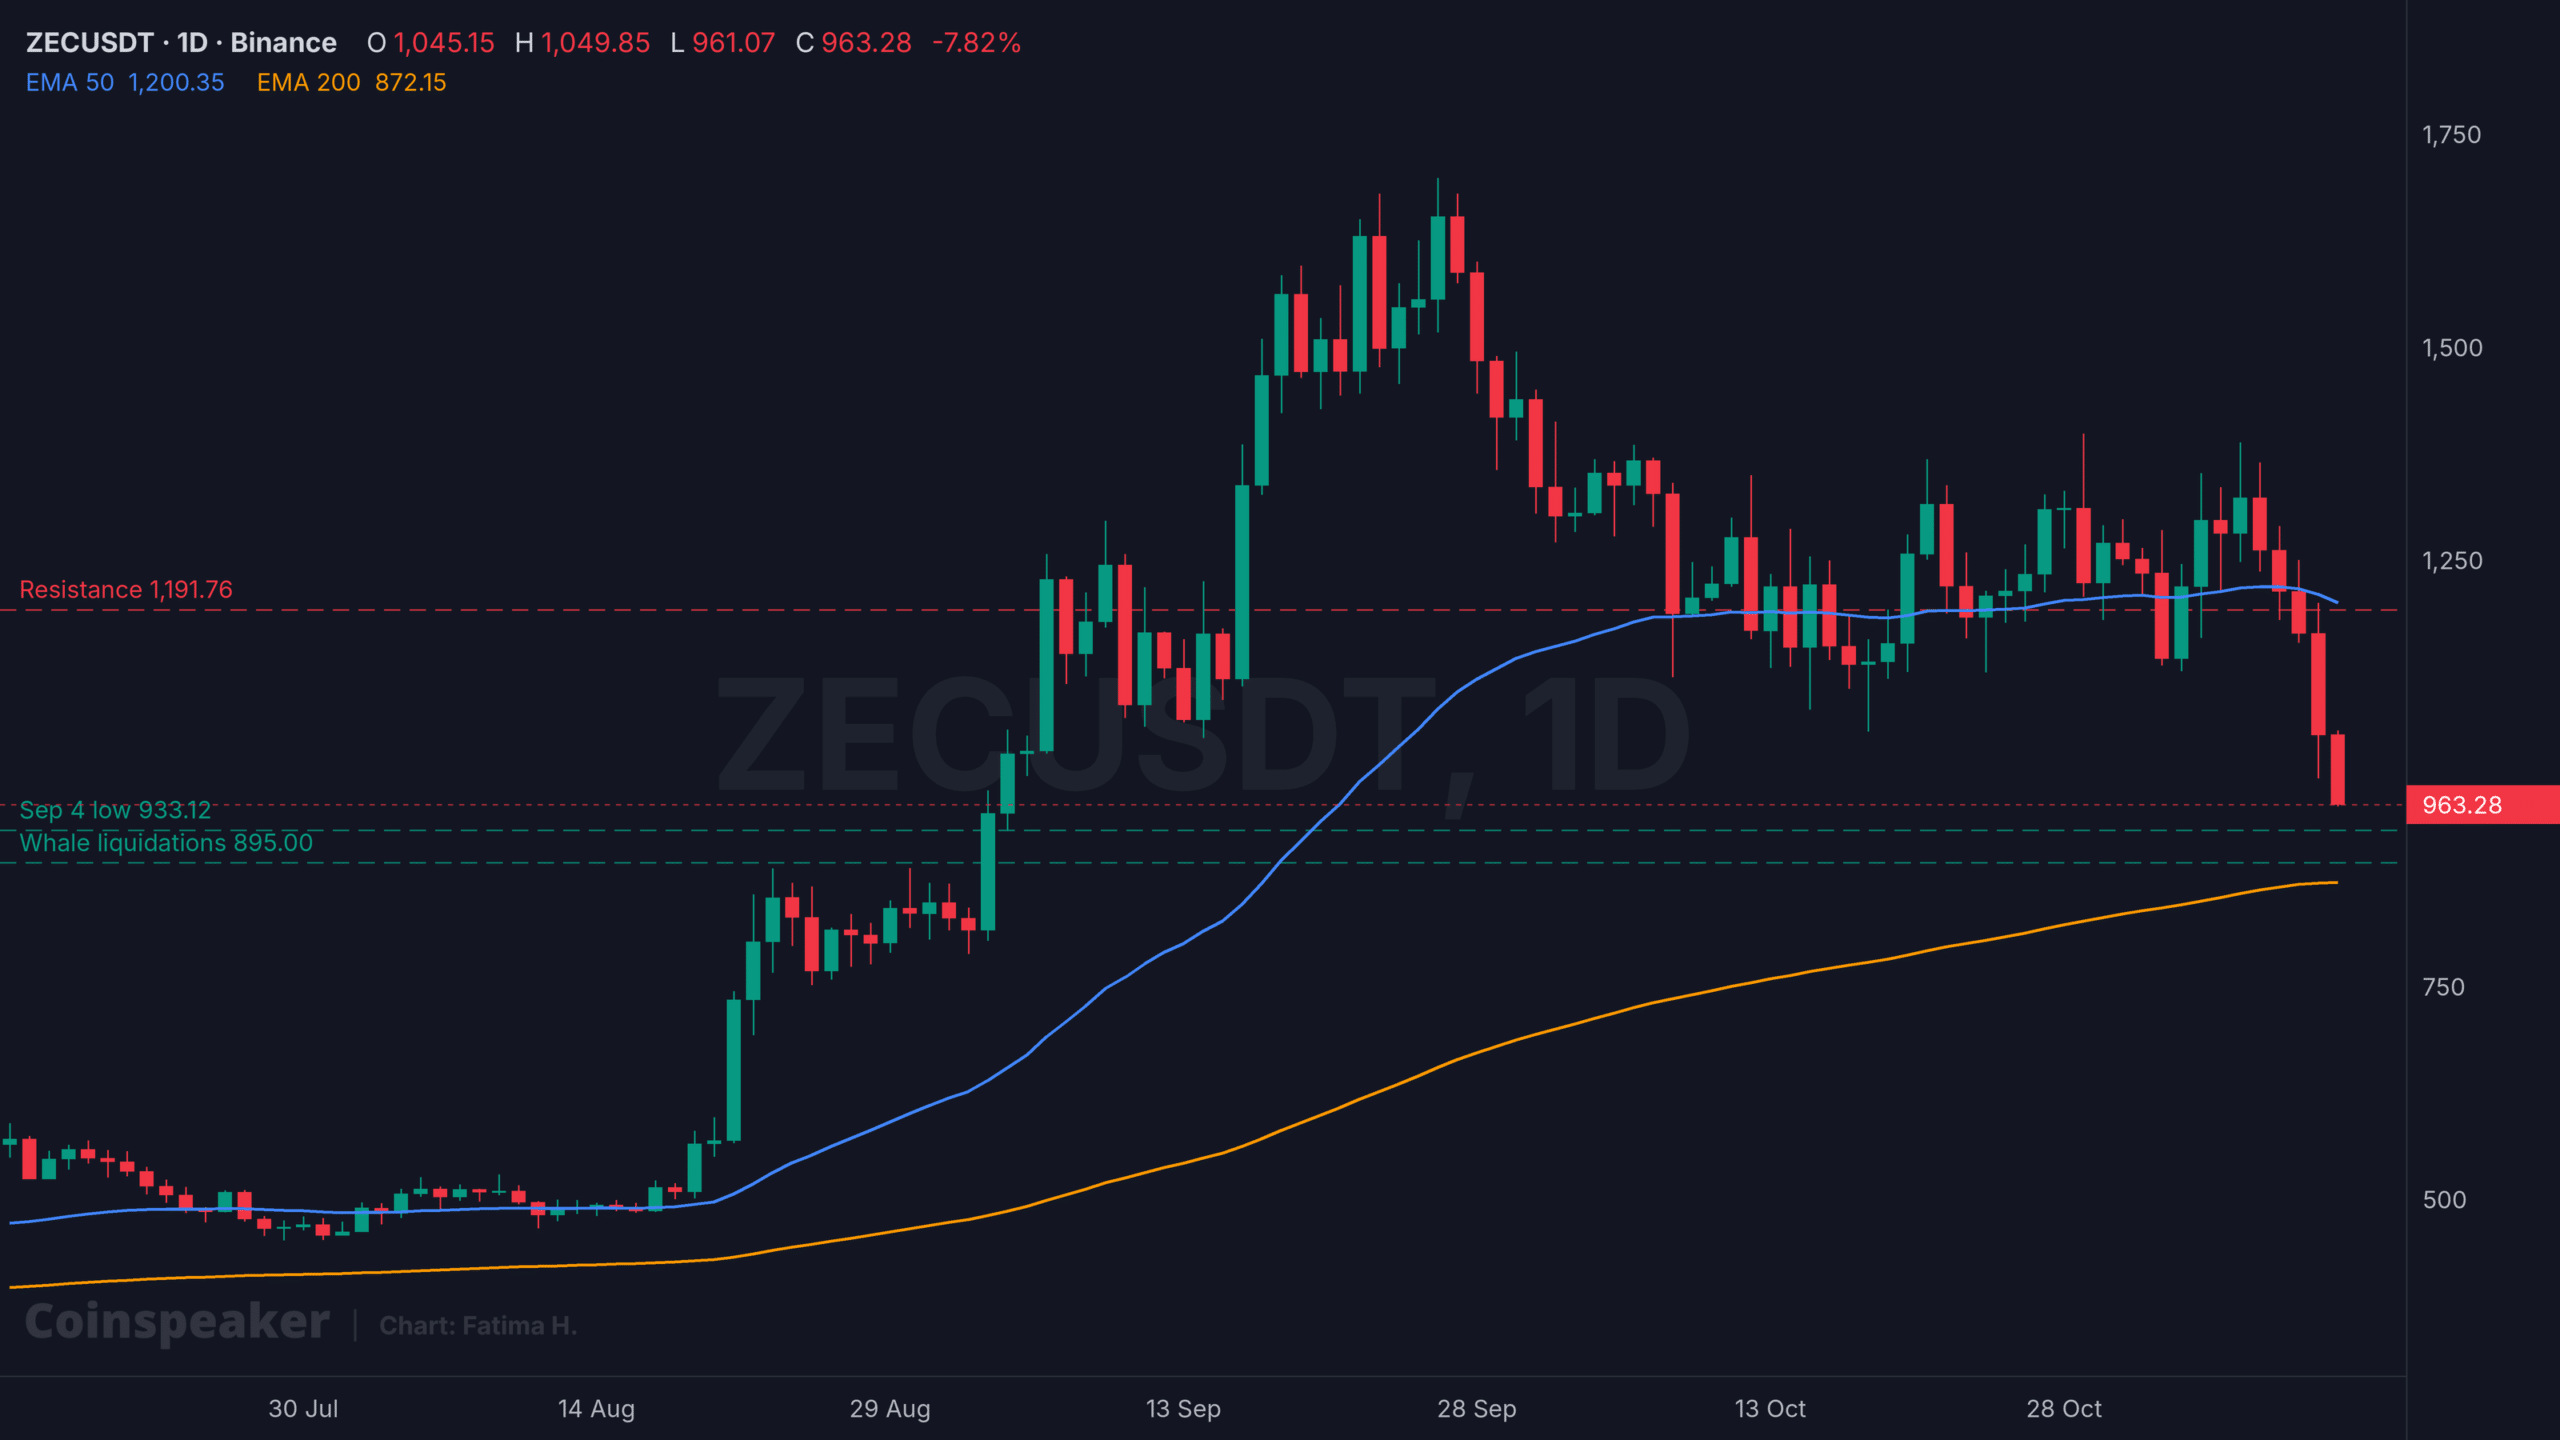
ZEC scenarios:
| Scenario | Trigger | Level to watch |
|---|---|---|
| Recovery | Daily close above $1,050 | $1,191.76 near the 50-day EMA |
| Holding pattern | Range between $933 and $1,050 | Base above the September 4 low |
| Further drop | Daily close below $933 | $895 liquidation zone, then 200-day EMA at $872 |
Bitcoin levels: $72,727 Tuesday low first; below that, $68,902 from August 20.
Conclusion: a hotter CPI raised odds of tighter Fed policy, pressuring crypto via higher yields and ETF outflows. ZEC’s outsized 2026 gains and concentrated leverage amplified its decline. A daily close above $1,050 would signal easing sell pressure; a break below $933 increases risk of liquidations near ~$895 and a test of the 200-day EMA.
Authors credited by the source: Daniel Francis
Published by Holder based on an external source.