Bitcoin falls below $66K; 200-week EMA acts as resistance
Bitcoin drops 7% to $65.7k. Traders watch the weekly close at the 200W EMA.
Bitcoin (BTC) fell over 7% intraday to $65,700 and sits near $65,600 at press time, down 6% week over week. The range $65k–$72k holds since early February.
Altcoin Sherpa says a loss of current levels could quickly send price another 6%–10% toward $60k–$62k. The setup tracks a two‑month bear flag on the daily chart.
Ted Pillows warns momentum is fading after BTC “lost its RSI uptrend,” calling it “a major sign of weakness.” He adds the breakdown is “a matter of when, not if,” recalling a similar two‑month bear flag earlier this year. Source: Ted Pillows on X.
Ali Martinez flags a historic drawdown window. He sees room for another 30%–45% drop toward the long‑term holder realized price band at $48,387 and the −0.2 SD band at $36,657. “I’ll be watching these zones for dip‑buying opportunities.” Source: Ali Martinez on X.
Rekt Capital notes BTC slipped below the 200‑week EMA again and is treating it as resistance into the weekly close. “If the 200‑week EMA is lost as support this week and price Weekly Closes below it again, Bitcoin could actually turn the EMA into new resistance.” He adds the level is acting as “unreliable” support/resistance, opening room for more retests and “additional Macro Downside over time.” Source: Rekt Capital on X.
Key levels and signals
- Range: $65k–$72k since Feb. Early‑Feb crash set the band.
- Near support: $60k–$62k per market technicians.
- Risk zones: $48,387 and $36,657 per long‑term bands. Ali Martinez
- Trend gauge: RSI uptrend break flagged as weakness. Ted Pillows
- Macro pivot: 200W EMA into the weekly close. Rekt Capital
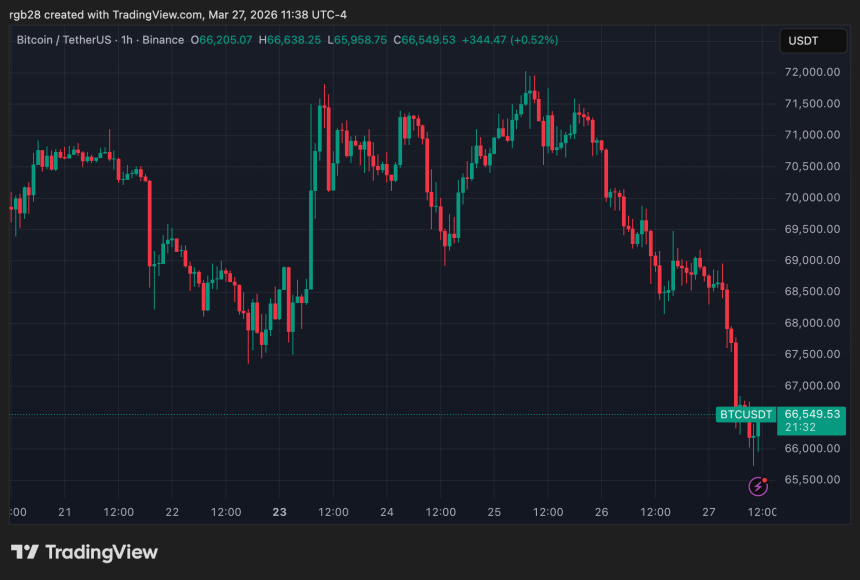
Price at publication: $65,600. Weekly change: −6%.
Authors credited by the source: Rubmar Garcia
Published by Holder based on an external source.