

Bitcoin falls below 200-day average before US jobs report
Bitcoin enters the 8:30 a.m. ET US October jobs release after closing Thursday at $76,088 and slipping below its 200-day average for the first time since August 19. BTC trades near $76,160, down 5.1% in 24 hours, after a chip-stock-led risk sell-off knocked it to $75,208, the lowest since September 16. The Crypto Fear & Greed Index fell from 50 to 28. Polymarket prices a 69% chance of a December 9 Fed rate hike, down from 80% a day earlier.
🚨 MARKET ALERT: U.S. UNEMPLOYMENT DATA DROPS TODAY AT 8:30 AM ET! 🇺🇸
One number could influence today's market reaction.
📊 Unemployment Rate
• Previous: 4.2%
• Forecast: 4.2%
Here's what I'm watching:
🔹 Above 4.2% → A weaker labor market could ease rate-hike concerns and… pic.twitter.com/6Zu5ewzubQ— OwenCarter (@OwenCarter0el) November 6, 2026
A review of 104 jobs releases since January 2018 shows mixed near-term outcomes: BTC was higher 24 hours later after 52 reports. The weekly pattern turned negative for the last three reports, with 7‑day declines of 3.3% in August, 5.2% in September, and 3.7% in October.
What Does Bitcoin Do After a Jobs Report?
We measured BTC from the hourly candle at each 8:30 a.m. ET release on Binance, using the Bureau of Labor Statistics archive. The October 2025 report was excluded due to a shutdown.
- First hour: higher after 58 of 104 reports. Average absolute move: 0.66%.
- 24 hours: higher after 52. Median move: +0.07%. Average absolute move: 1.92%.
- 7 days: higher after 57. Median gain: 0.67%.
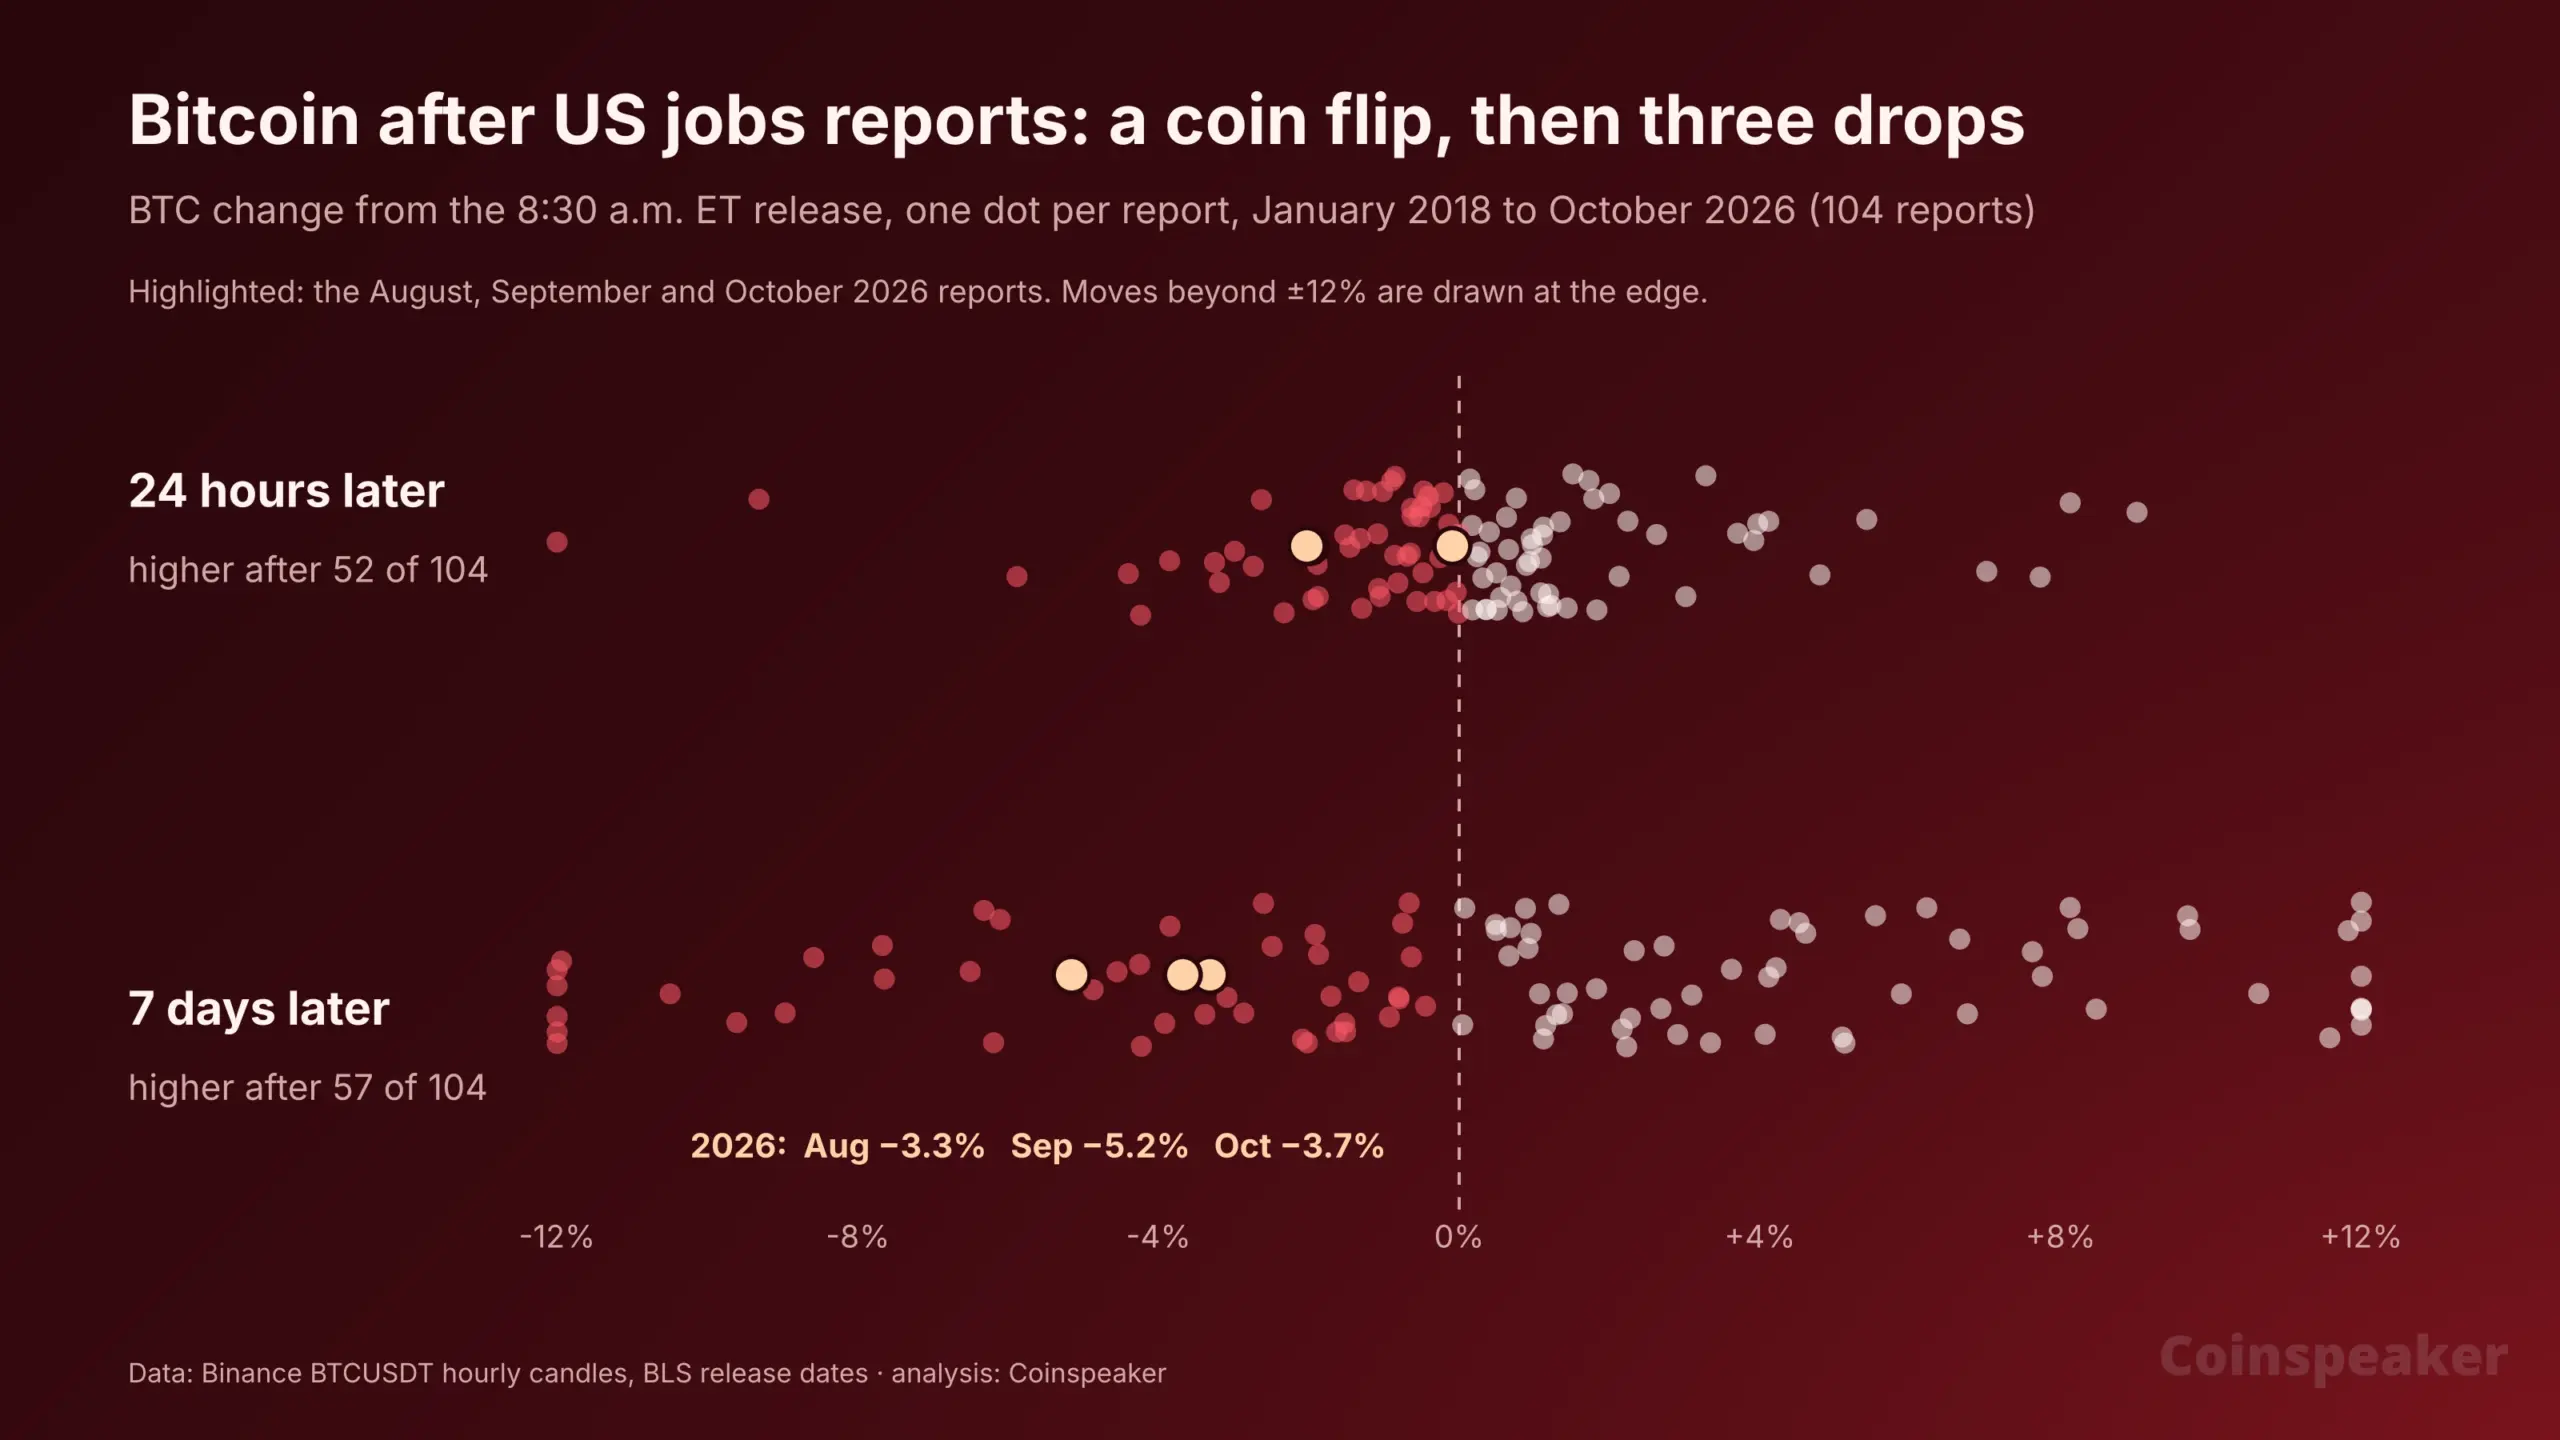
Pattern in 2026: BTC was higher one week after each of the first seven reports by 0.5% to 7.6%, then declined after all three since August. Other news often dominates the week. The worst 24-hour move followed the December 2021 report, a 17.1% drop coinciding with a weekend leverage flush.
Why This Jobs Report Matters for the Fed
The Fed leans toward a hike rather than a cut. It held rates at 3.75% to 4% on October 28 in a 10–2 vote, with both dissenters favoring a quarter-point hike. Thursday’s risk-off move reduced hike odds: Kalshi’s December hike probability fell by 10 points in a day, while the chance of a hold rose from 22% to 32%. A strong jobs report would likely lift hike odds. A weak report would support a wait-and-see stance, easing pressure on risk assets.
BTC Price Analysis: Can Bitcoin Reclaim Its 200-Day EMA?
BTC trades about $380 below the 200-day EMA at $76,540, which had held on every daily close since August.
- Resistance: $76,540 at the 200-day EMA, then $79,839 at the 50-day EMA. Above that, $81,196, Wednesday’s high.
- Support: $75,208, Thursday’s low, then $74,968, the September 15 low. Below that, $72,598 at the 0.5 Fibonacci retracement.
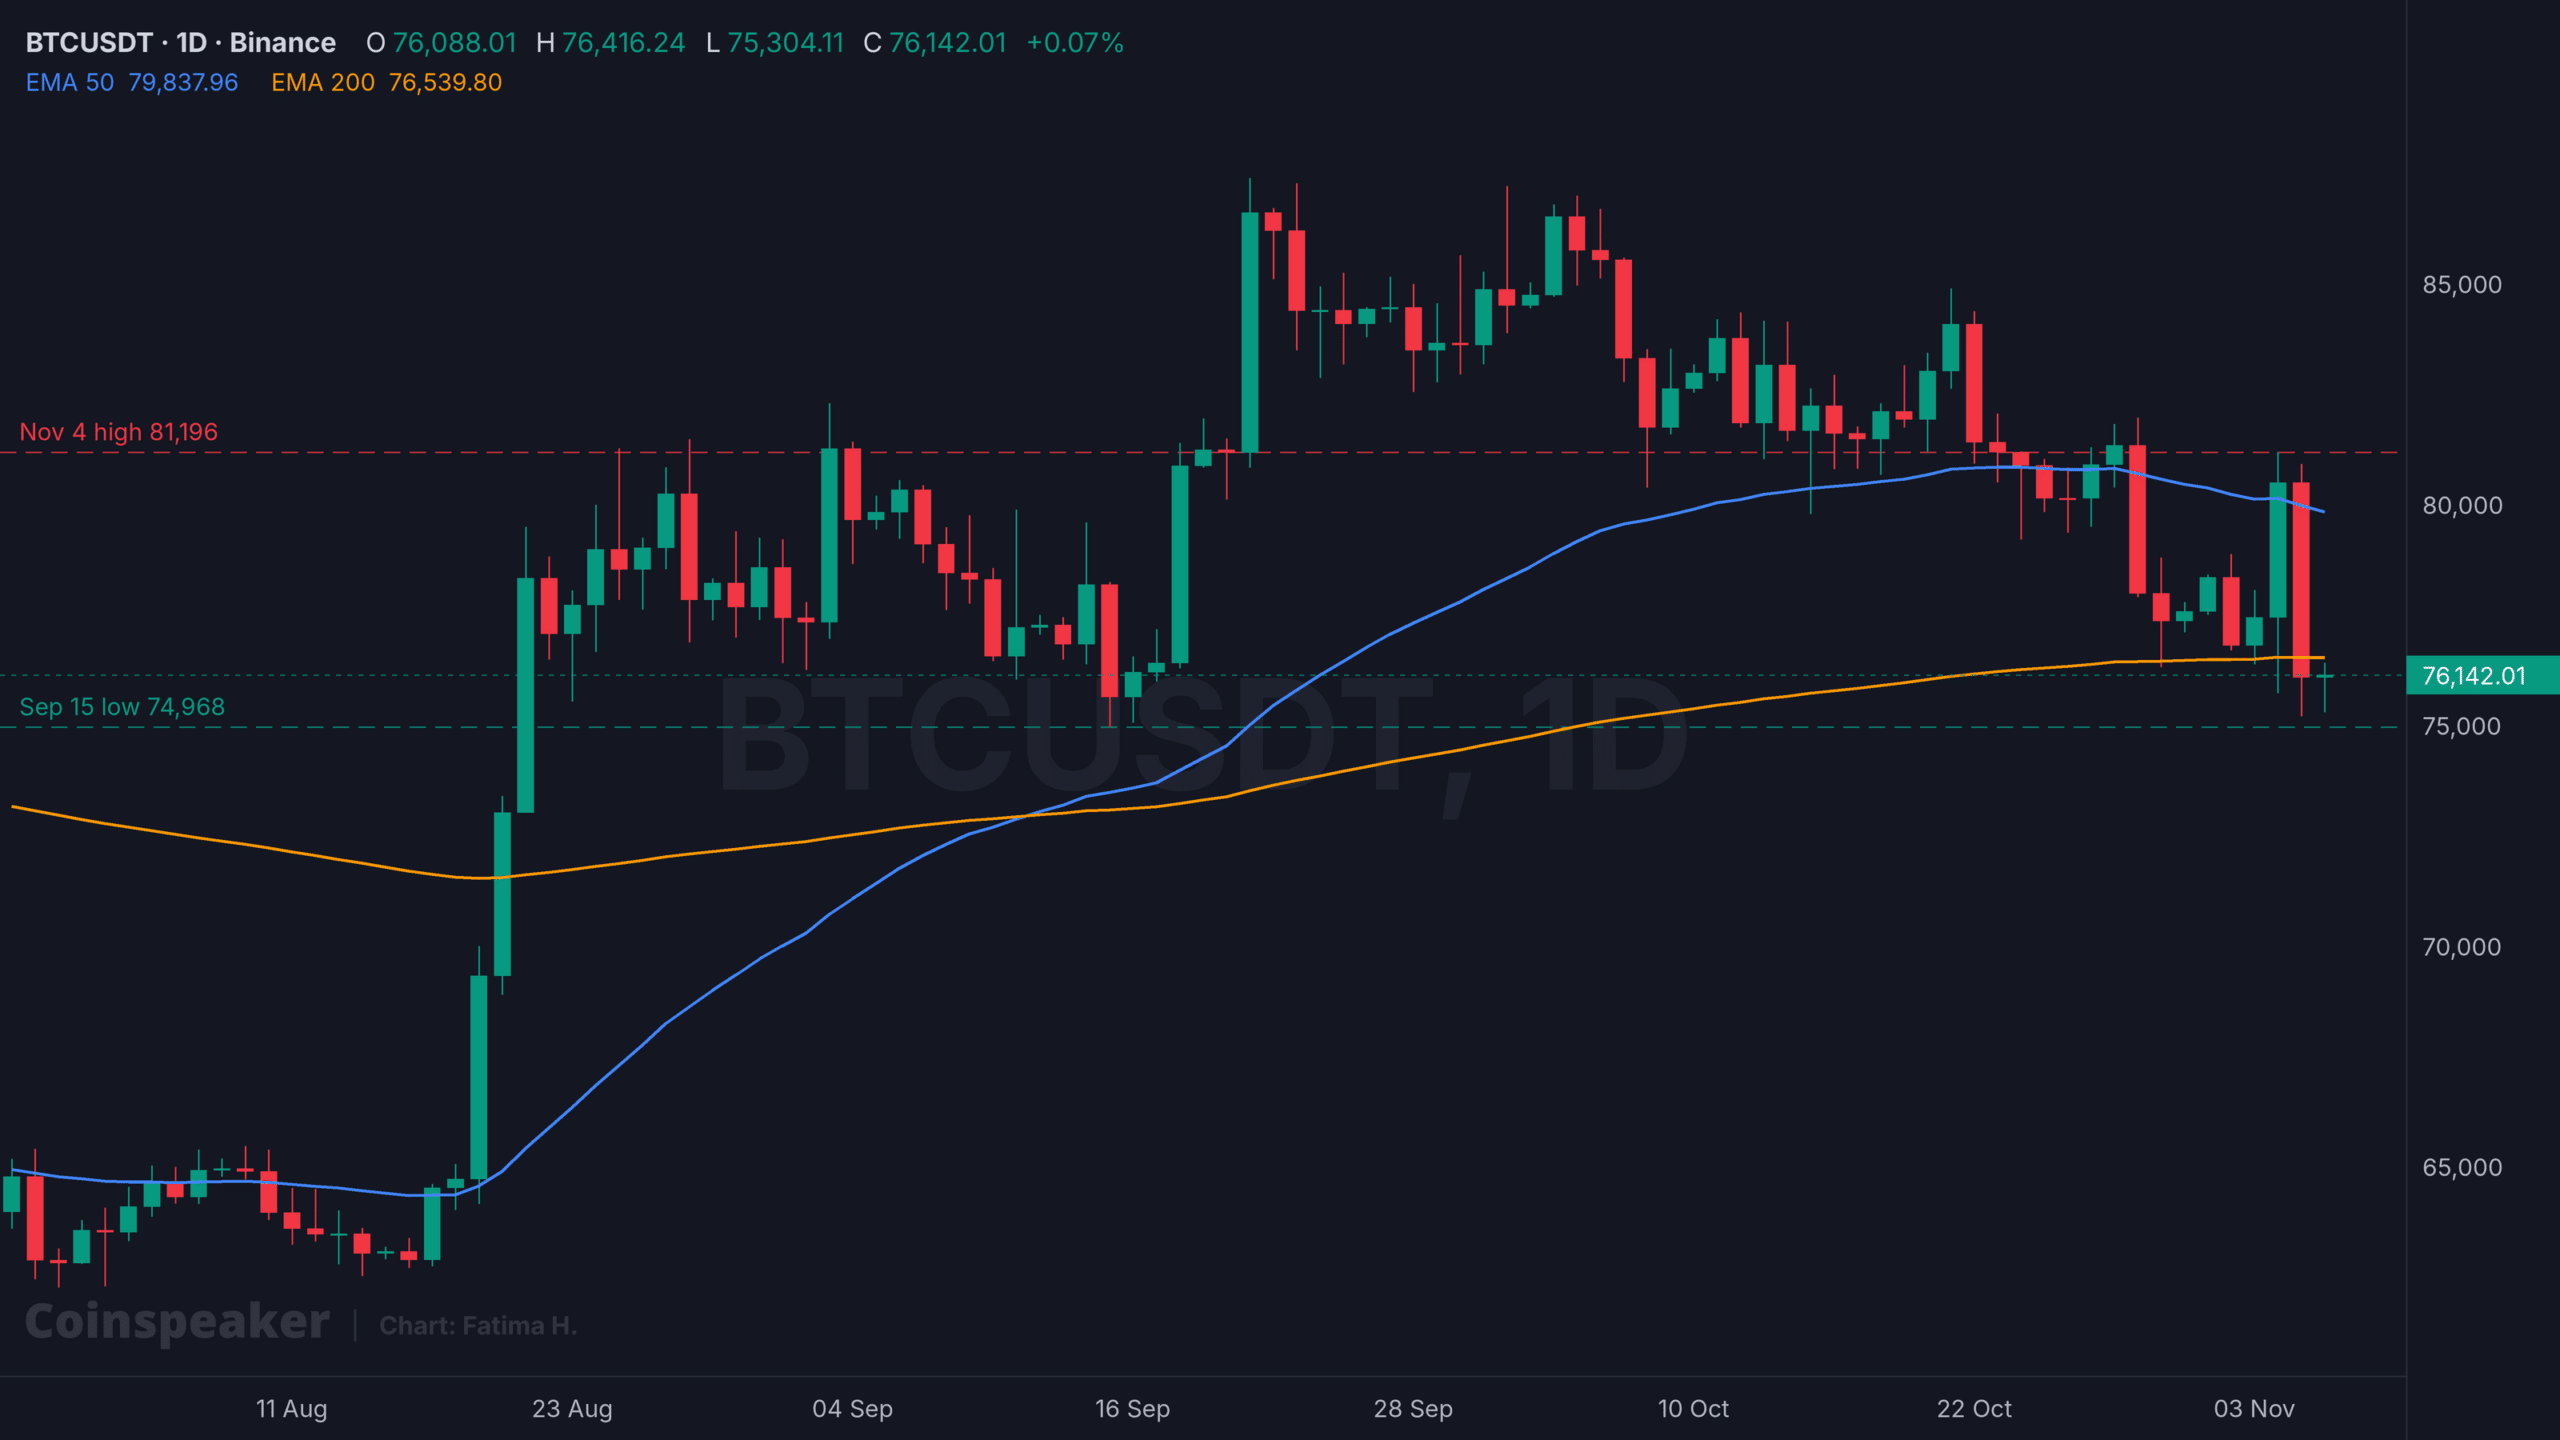
BTCUSDT 1D chart. Source: TradingView
| Outlook | Trigger | Level to watch |
|---|---|---|
| Rebound | A daily close back above $76,540 | $79,839, the 50-day EMA |
| Holding pattern | BTC stays between $74,968 and $76,540 | Range trade while traders digest the jobs data |
| Sell-off | A daily close below $74,968 | $72,598, the 0.5 Fibonacci level |
The jobs report rarely sets BTC direction on the day. The weekly close relative to the 200-day EMA is the higher-impact signal.
Authors credited by the source: Daniel Francis
Published by Holder based on an external source.