
Bitcoin drops to $72,700 as liquidations mount and ETFs see outflows
Bitcoin fell below $73,000 on Thursday, November 12, extending a week-long crypto drawdown with repeated long liquidations. BTC touched $72,735 on Binance, near Tuesday’s $72,727 low and the weakest since August 20. It trades at $72,969, down 9.4% from the November 4 close.
BREAKING: $BTC just fell to its lowest level since August.
Over $210 million worth of longs liquidated in the past 24 hours.
The dumping continues… pic.twitter.com/R7NVGivFnD
— Crypto Rover (@cryptorover) November 12, 2026
Altcoins underperformed over seven days: Ethereum −16.4%, Solana −14.7%, XRP −21.3%. Total crypto market cap: $2.42 trillion per CoinGecko, with Bitcoin dominance at 60.5%.
Leverage amplified the drops. Over $1 billion in positions were liquidated Monday, mostly longs. Liquidations force exchanges to close positions when collateral depletes, which adds sell pressure.
Four shocks in four days
- Mon, Nov 9: Reports of a probe involving Nvidia CEO Jensen Huang and stalled U.S.-Iran talks pressured risk assets. $1.15 billion in crypto liquidations, $1.04 billion longs.
- Tue, Nov 10: Hot inflation data raised odds of a December Fed rate hike. $723 million liquidated, about $570 million longs.
- Wed, Nov 11: MSCI said it will drop Strategy, the largest corporate Bitcoin holder, from its indexes. After-hours, Nvidia fell 9% as its board weighed removing Huang.
- All week: Net outflows from U.S. spot Bitcoin ETFs on seven of the first eight November sessions totaled about $1.88 billion.
Longs continued to be forced out. Over the past 24 hours on OKX across BTC, ETH, SOL, XRP, and DOGE futures: $27.6 million in long liquidations versus $12.3 million in shorts.
Leverage remains elevated
- Positioning: On OKX, the long-to-short account ratio in BTC rose to 3.11 from 2.43 on November 4.
- Funding: Positive at 0.0092% per 8 hours on OKX, about 6% annualized over the past week. Longs are paying shorts.
- Open interest: BTC futures OI on OKX holds at $3.85 billion, unchanged from before Monday’s flush.
Leverage has not reset. If price breaks support, remaining longs can trigger further forced selling. Durable bottoms tend to align with negative funding and falling open interest.
Sentiment at 28: limited edge
The Crypto Fear & Greed Index reads 28. Historical outcomes on days at or below 28 since February 2018, across 943 instances:
- 30 days later: BTC higher 55% of the time, median +1.1%.
- 90 days later: BTC higher 48% of the time, median −2.8%.
- Any 90-day period: BTC higher 54% of the time, median +3.6%.
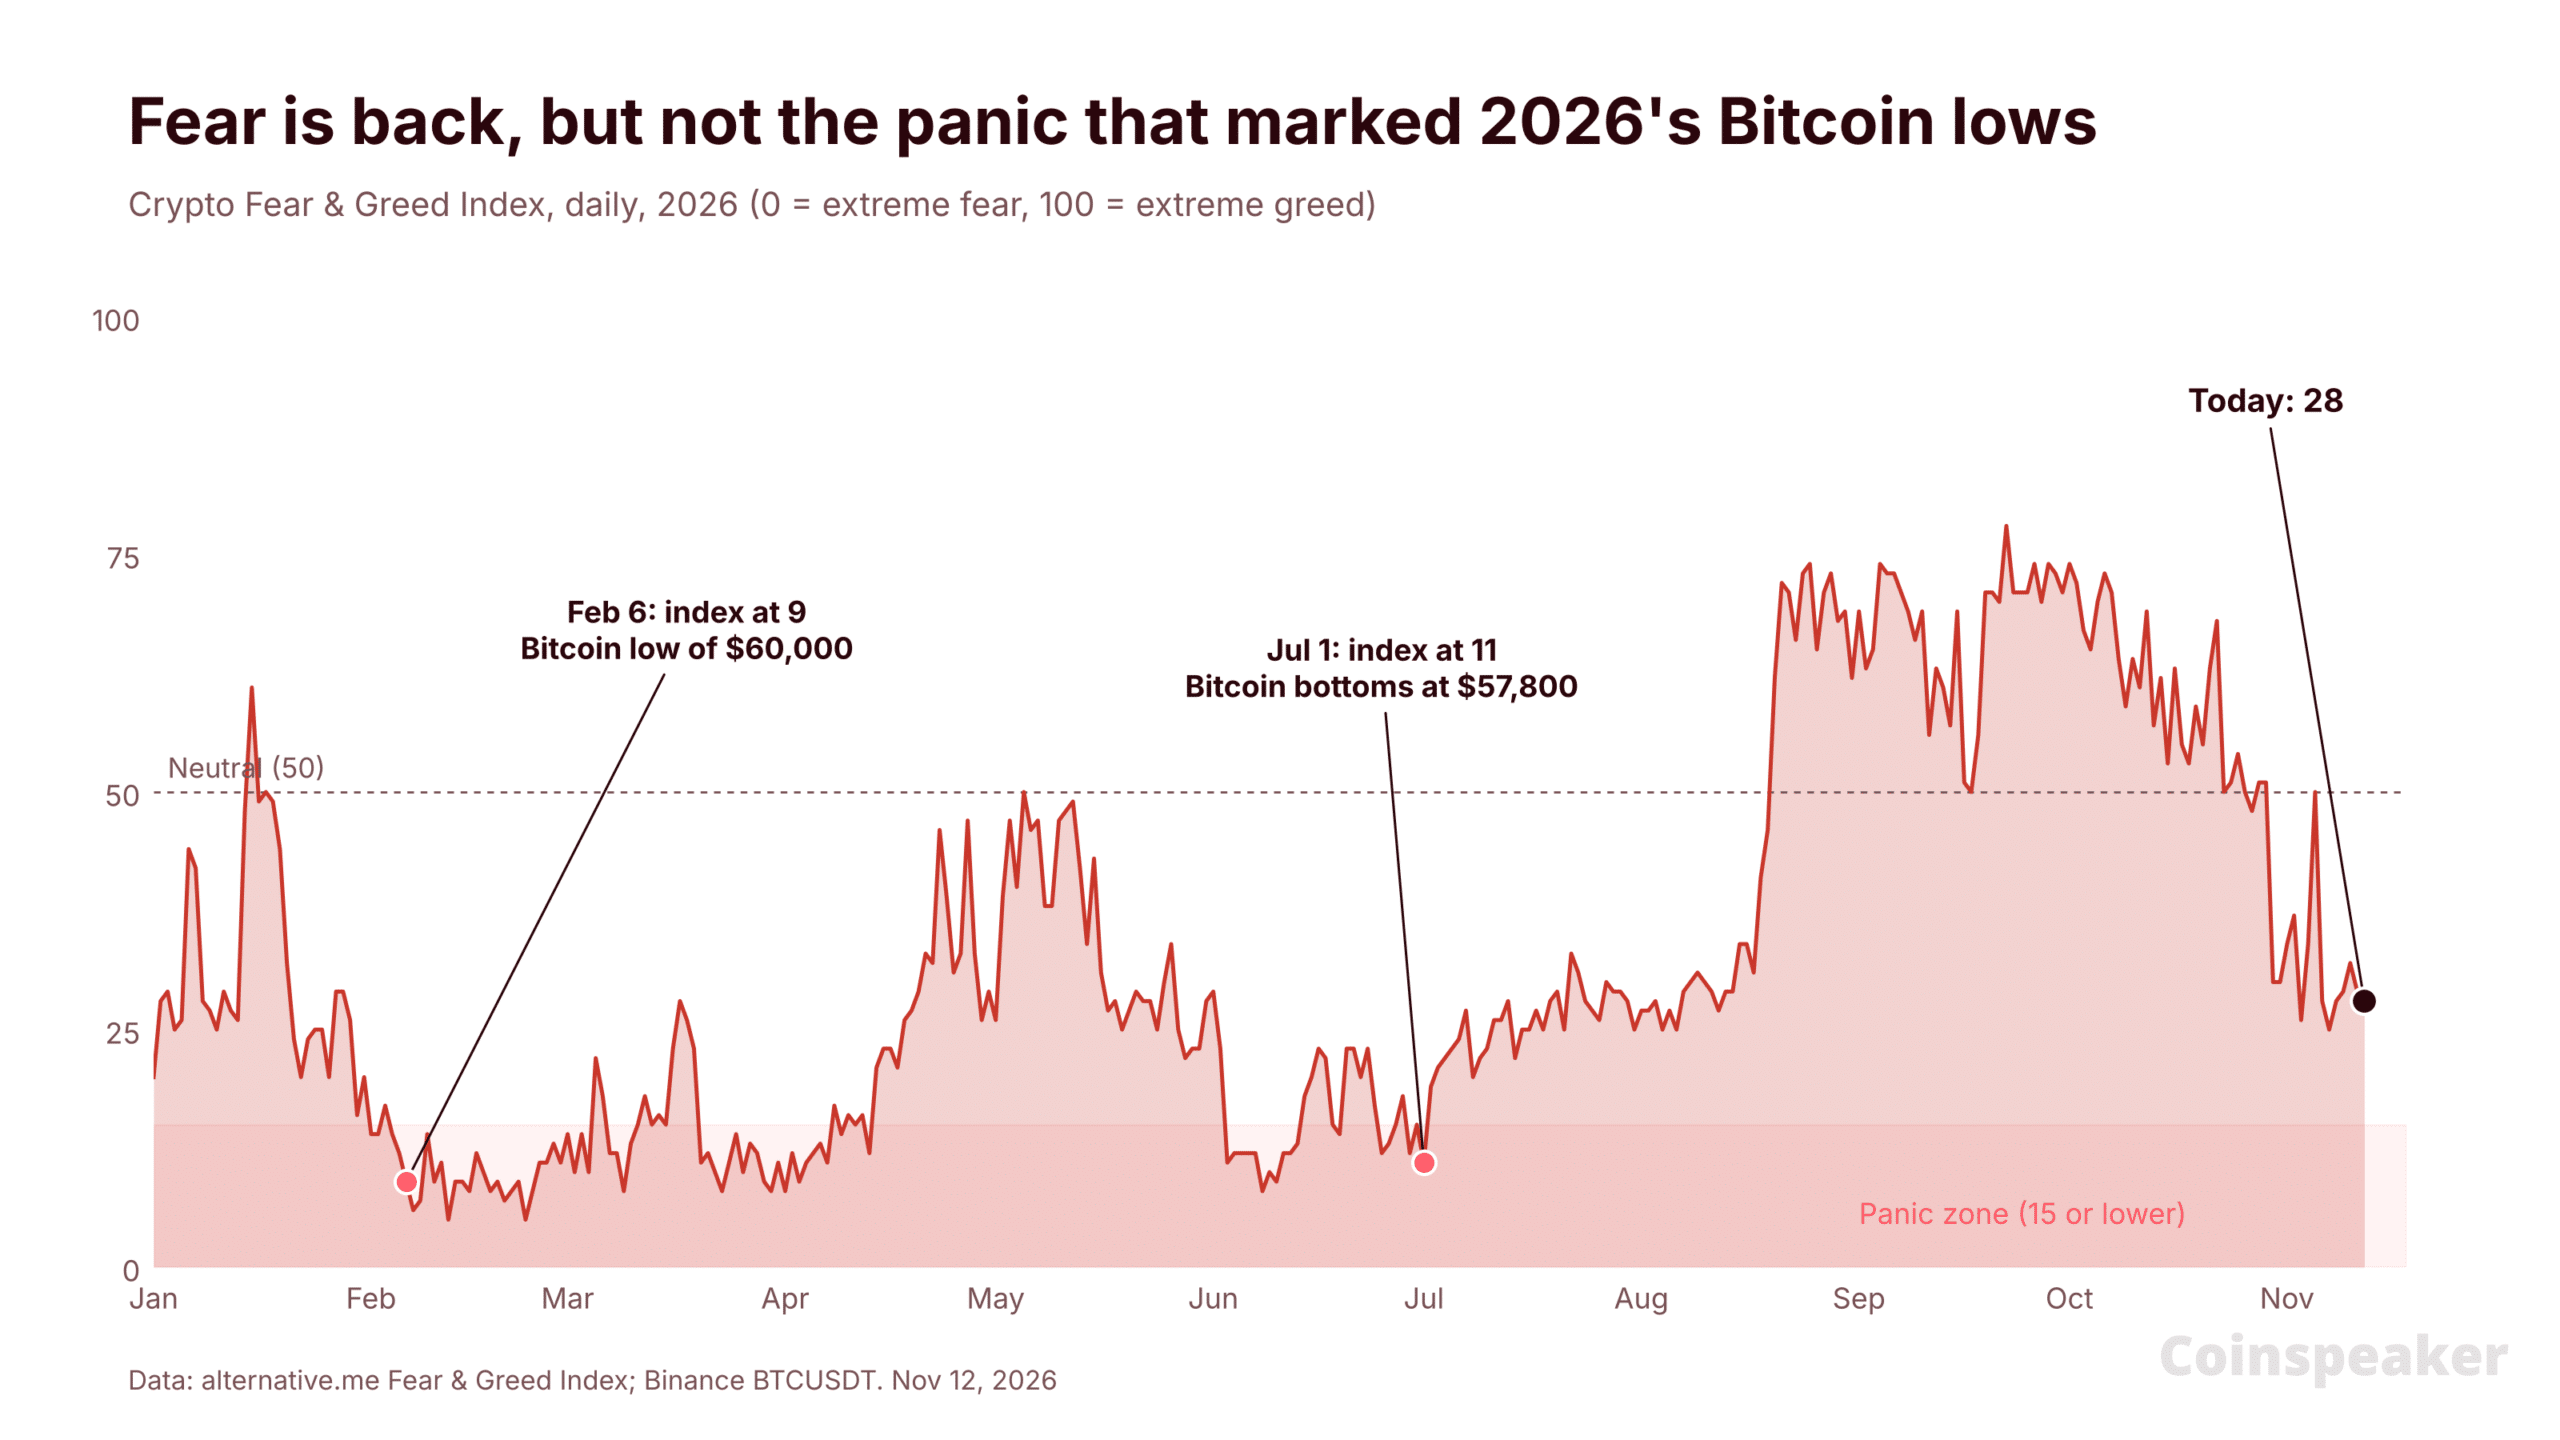
2026’s prior lows showed capitulation: index at 9 near $60,000 on February 6 and 11 near $57,800 on July 1. Today’s 28 signals fear without capitulation.
Price structure and key levels
BTC’s 2026 weekly range: low $57,800 on July 1, high $87,396 in late September. Midpoint: $72,598. Price lost the 50-week EMA at $78,219. The 200-week EMA: $69,597. BTC spent 16 weeks below the 200-week EMA this year, and both major lows formed during those periods.
- Resistance: $78,219 (50-week EMA), then $82,850 (May high), then $87,396 (range high).
- Support: $69,597 (200-week EMA), then $65,000 (March low), then $60,000 and $57,800 (February and July lows).
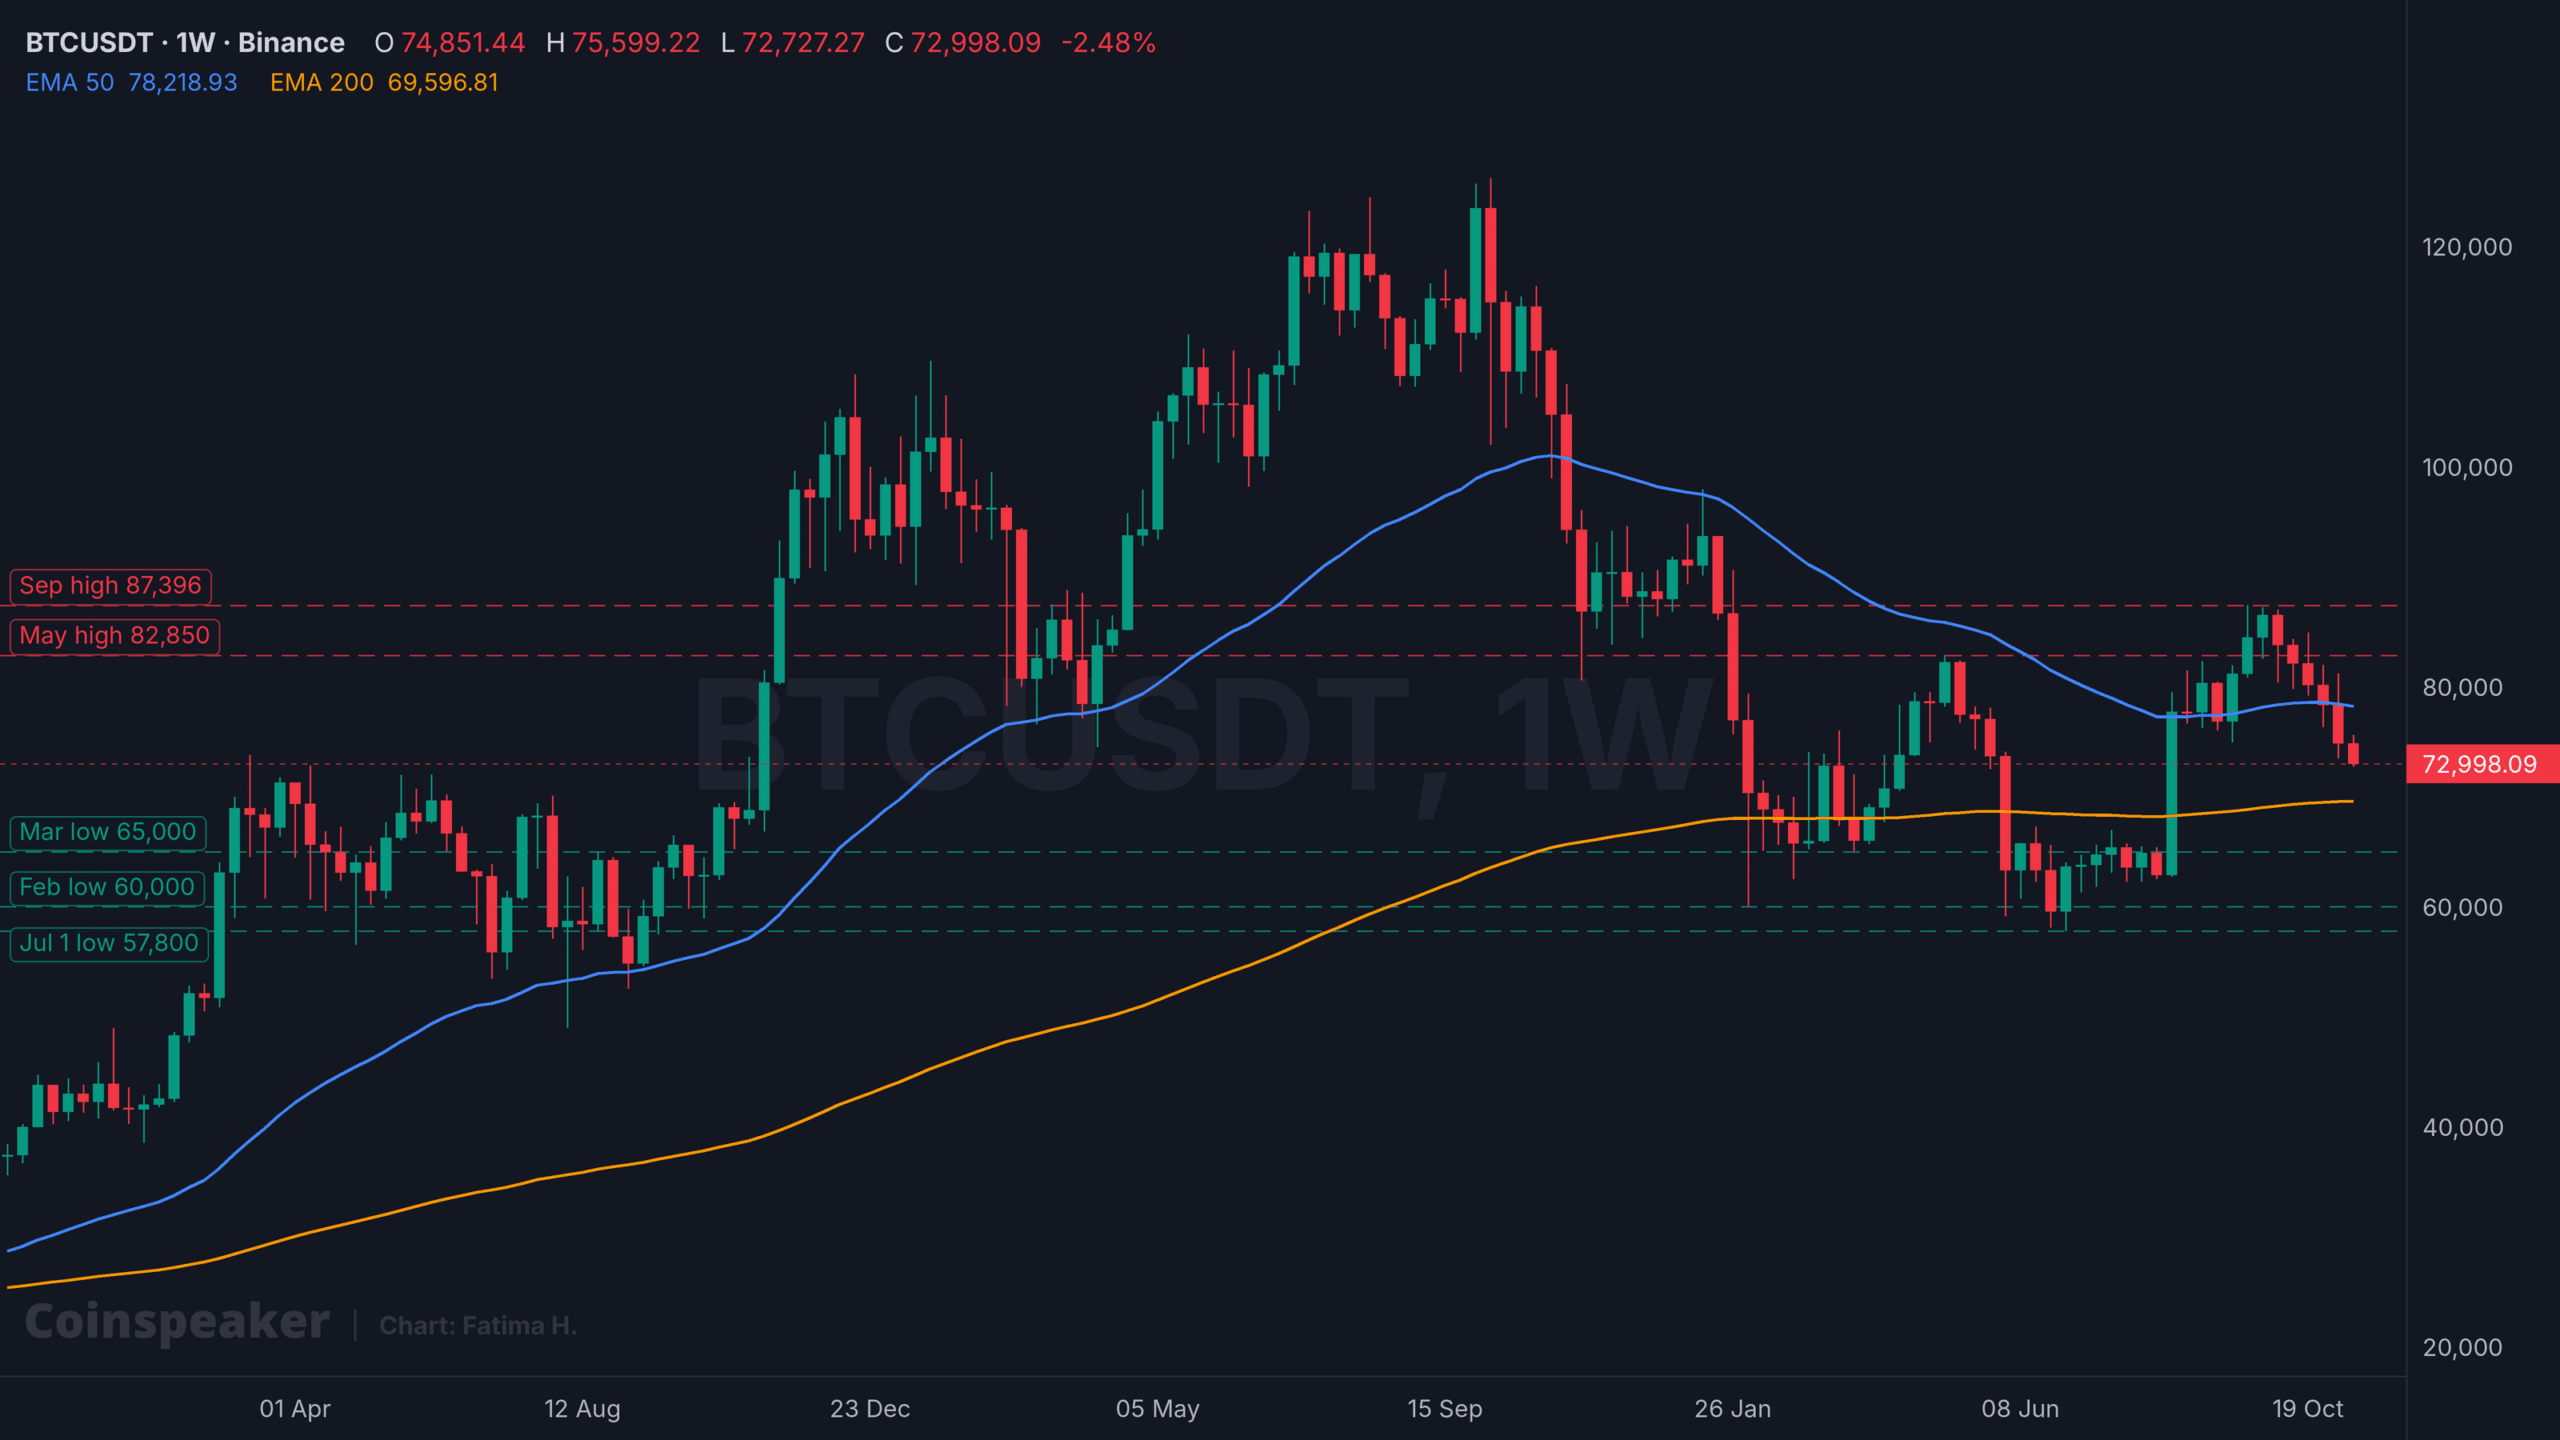
BTCUSDT 1W chart. Source: TradingView.
| Outlook | Trigger | Level to watch |
|---|---|---|
| Rebound | Weekly close back above $78,219 | $82,850, then $87,396 |
| Holding pattern | Weekly closes between $69,597 and $78,219 | Range around the $72,598 midpoint |
| Sell-off | Weekly close below $69,597 | $65,000, then $60,000 and $57,800 |
Bottom signals to monitor: the fear index in the teens, negative funding, and a drop in open interest indicating long capitulation. These have not appeared. The 200-week EMA at $69,597 separates a pullback within the 2026 range from a potential retest of summer lows.
Authors credited by the source: Daniel Francis
Published by Holder based on an external source.