
Liquidation cascade drives Bitcoin to $73,510 in thin weekend trading
Bitcoin fell from $75,607 to $73,510 in ten minutes on Sunday evening, the lowest since August 21. The sharpest minute was 21:55 UTC with a 1.9% drop on Binance. BTC traded at $74,184 Monday morning, 2.2% below its level when the Nvidia report appeared, and logged a fifth straight losing week with a weekly close at $74,851 below the $78,354 open.
Catalysts and Sequence
- Nvidia probe timing: CNBC published at 20:12 UTC. BTC was $75,880 then and drifted only 0.4% over the next 90 minutes.
- Sell-off onset: From 21:50 to 21:55 UTC, ETH fell 6.9% on Binance, BTC fell 2.4%, consistent with a liquidation cascade that forced leveraged longs to close.
- Reported liquidations: Roughly $1 billion liquidated in ten minutes across crypto.
- Context linkages: Bitcoin has tracked AI equities. A prior chip-stock sell-off had pushed BTC below its 200-day average. With equities shut, crypto reflected the Nvidia headline risk.
- Additional macro headline: Secretary of State Marco Rubio described Iran’s demands as “outrageous,” signaling no progress in talks, adding risk-off tone.
After Jensen Huang admitted having an affair, a whale opened a 10x short on 30,000 $NVDA ($5.44M) on Hyperliquid.https://t.co/RztJx5FNge pic.twitter.com/zuyV2K0ftN
— Lookonchain (@lookonchain) November 9, 2026
BREAKING: $1,000,000,000 liquidated from the crypto market in the past 10 minutes.$BTC falls under $74,000$ETH falls under $2,125$XRP falls under $1.10 $SOL falls under $90 pic.twitter.com/hIZhzQFJJe
— Watcher.Guru (@WatcherGuru) November 8, 2026
Market Microstructure: Weekend Liquidity
- Typical Binance BTC volume: $24 million per weekend hour versus $48 million per weekday hour.
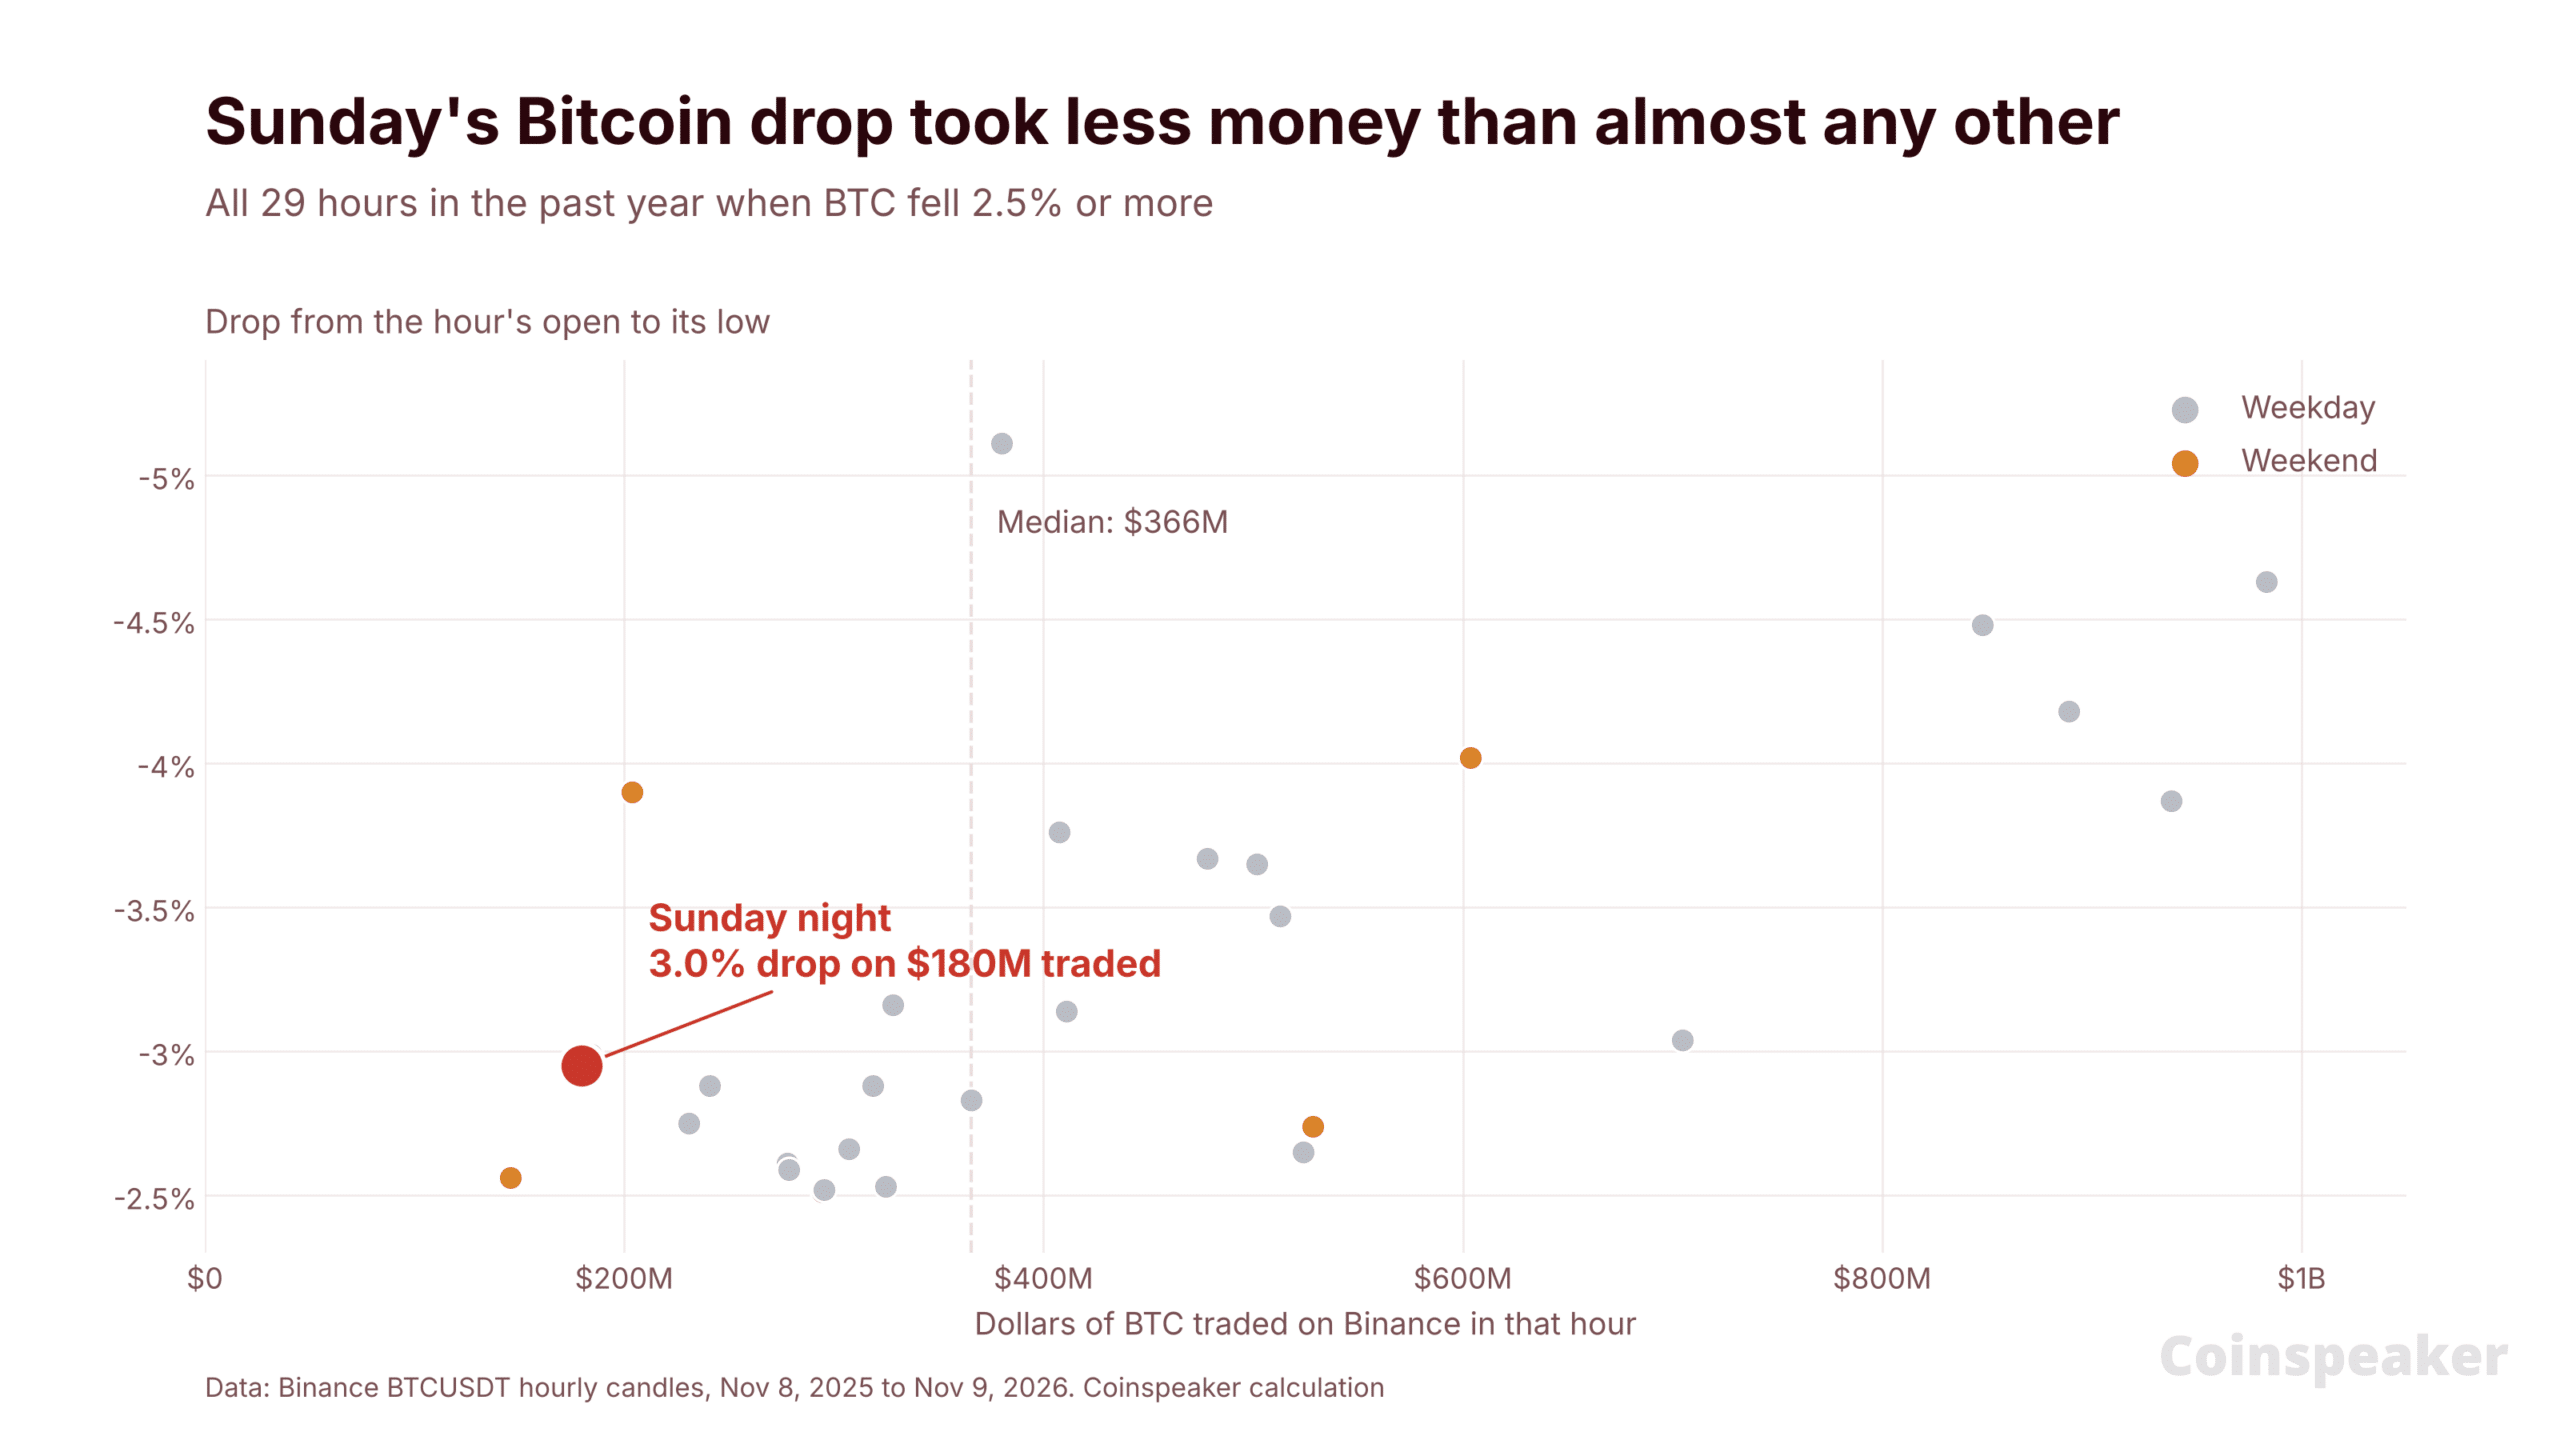
- Of 29 hourly drops ≥2.5% over the past year, Sunday’s hour traded $180 million on Binance, the second-lowest volume among those events and about half the $366 million median.
- Peak minute volume: $75 million at 21:55 UTC, around three times a typical weekend hour, sufficient to trigger cascading liquidations in thin order books.
- Incidence: 6 of the 29 ≥2.5% down hours occurred on weekends, slightly below weekends’ 29% share of all hours. Weekends reduce depth, increasing price impact per dollar sold.
- Note: Futures-driven liquidations amplify moves and are not fully captured by spot volume.
Technical Levels
- Structure: BTC trades below its 50/100/200-day EMAs. It lost the 200-day EMA on Thursday.
- Immediate action: First test of $73,510 held, followed by a bounce to $75,735, then a slip to $74,184.
- Resistance: $75,735, then $76,490 at the 200-day EMA, then $77,607 at the 100-day EMA.
- Support: $73,510. Below: $73,027, the August 21 low.
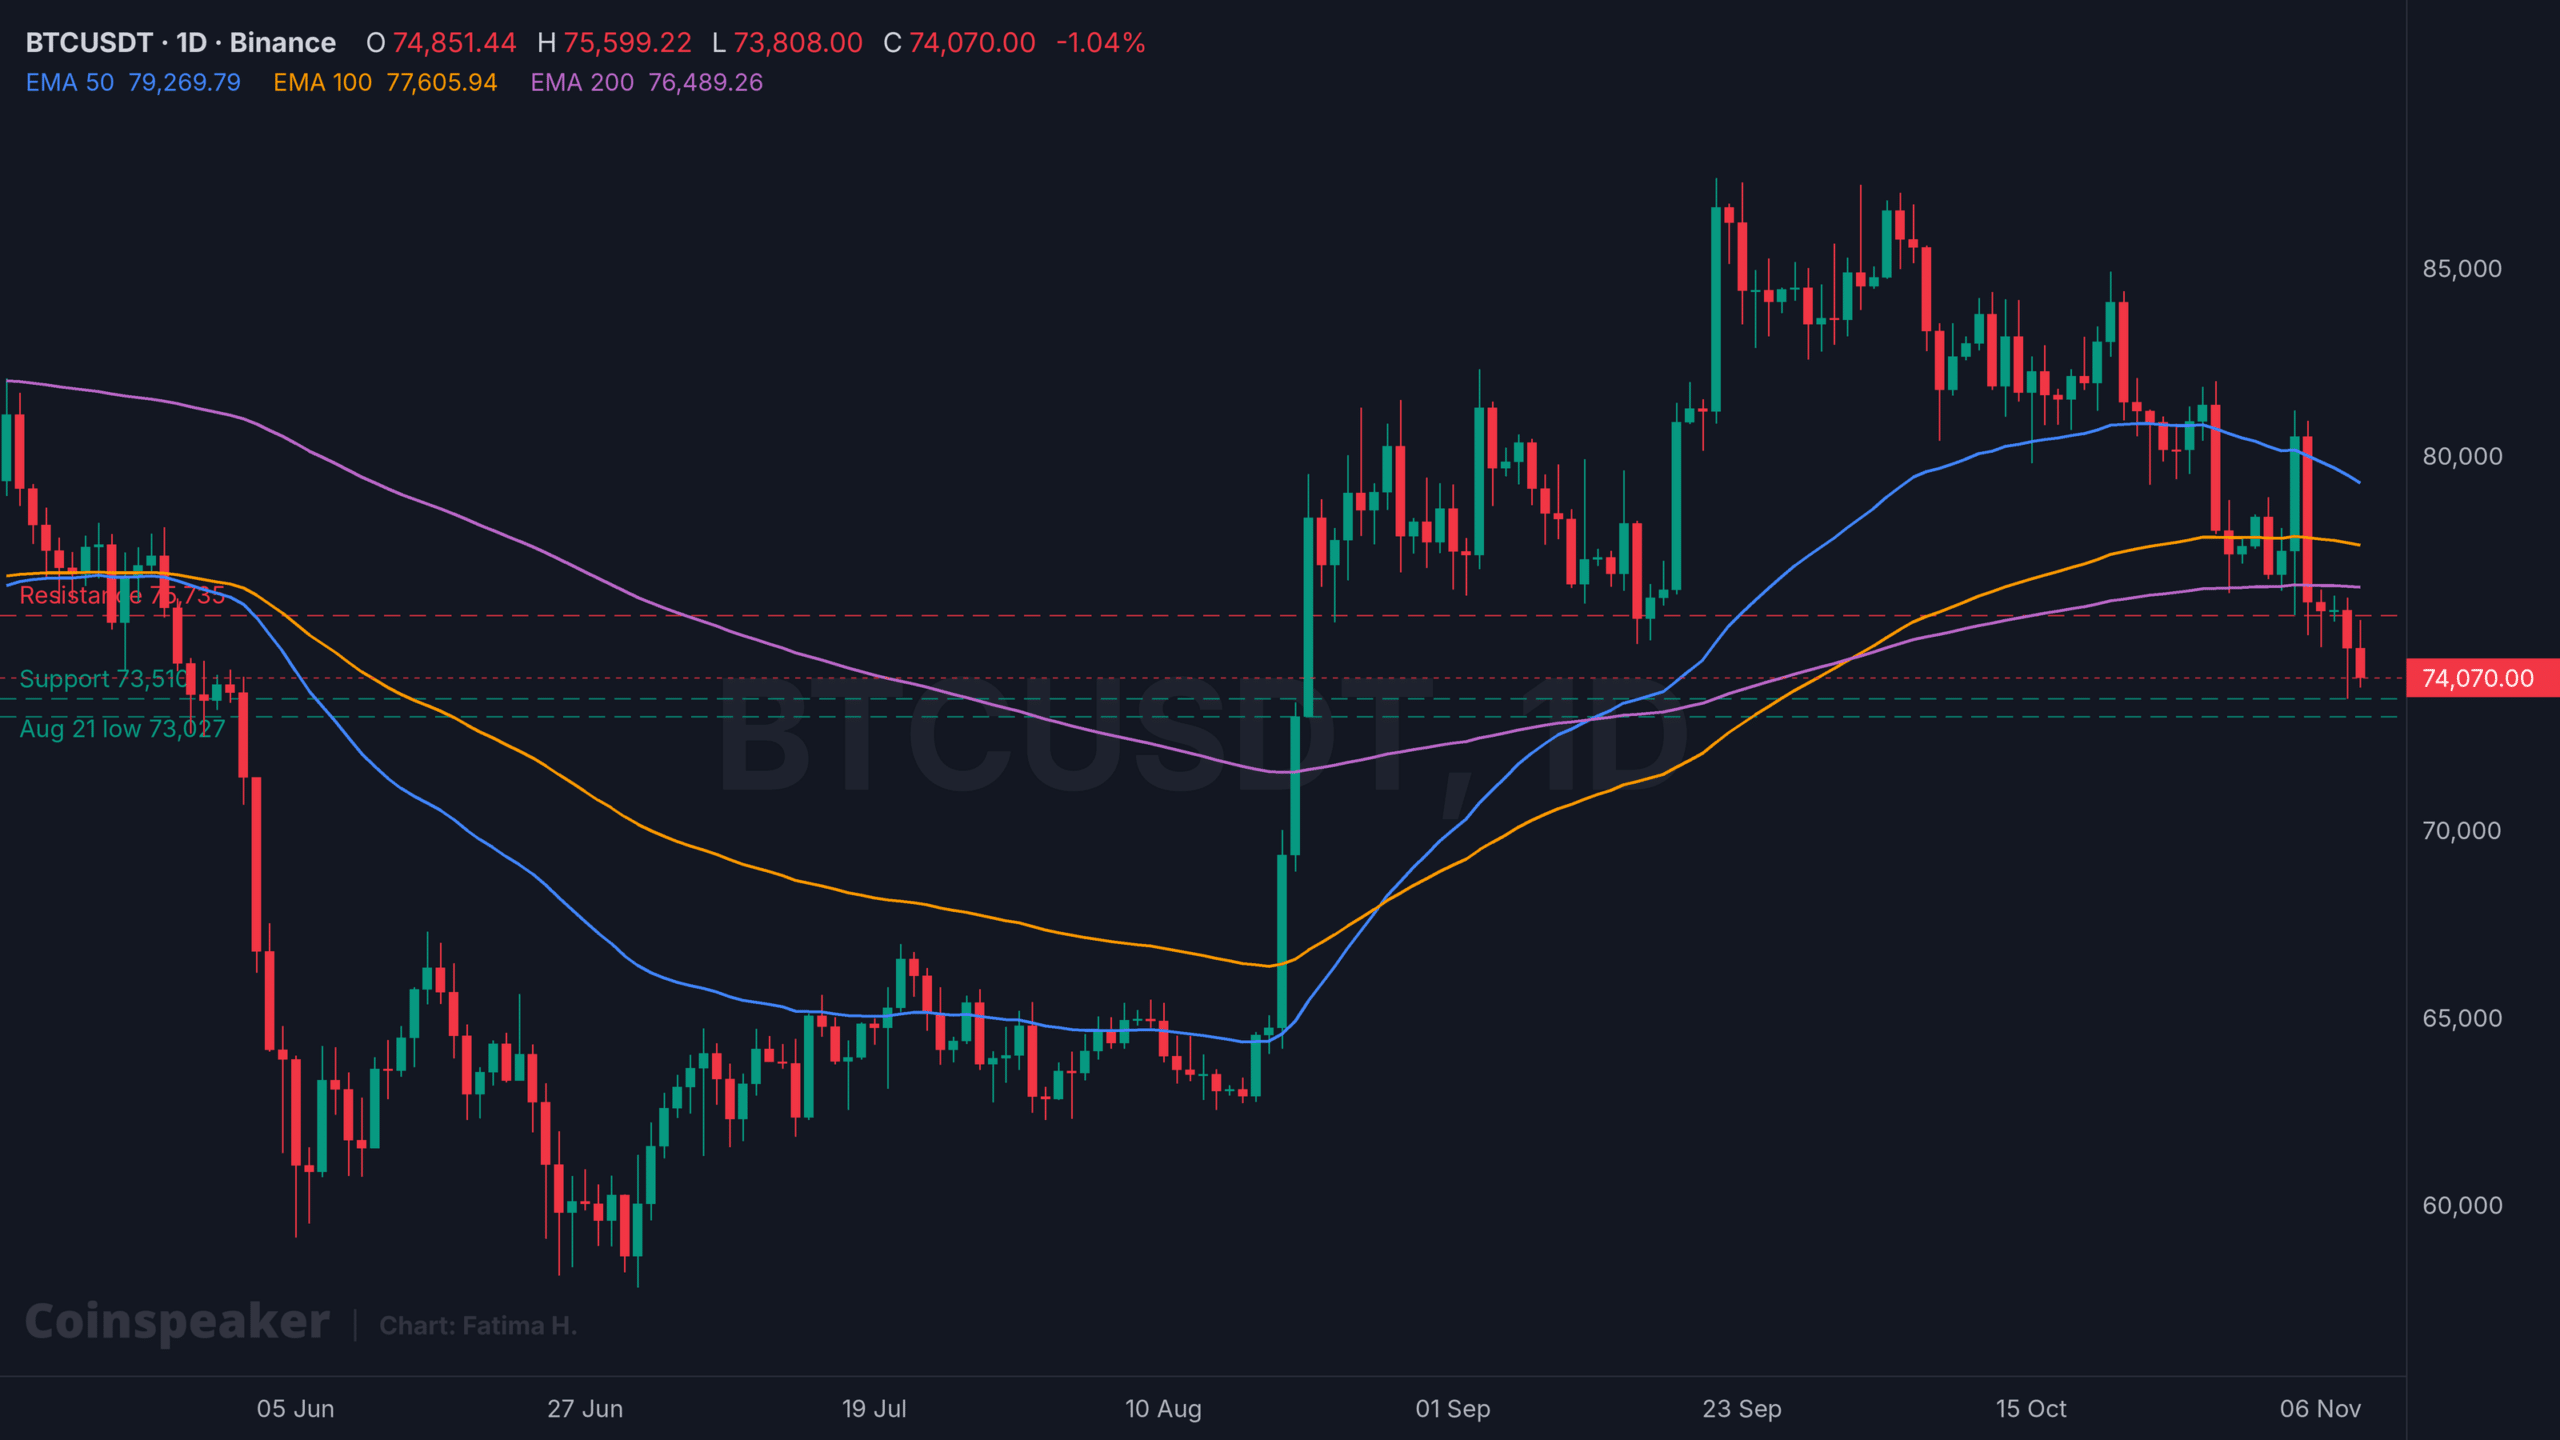
BTCUSDT 1D chart. Source: TradingView
| Outlook | Trigger | Level to watch |
|---|---|---|
| Rebound | A daily close above $76,490 | $77,607, the 100-day EMA |
| Holding pattern | BTC stays between $73,510 and $76,490 | A range below the 200-day EMA |
| Sell-off | A daily close below $73,510 | $73,027, the August 21 low |
Near-term Event Risk
- U.S. equity open Monday is the first opportunity for Nvidia shares to price the headline, ahead of earnings on November 17.
- Risk-on correlation with AI and chip stocks remains a key driver for BTC.
- Geopolitical tone from Iran-related statements added to risk aversion.
Conclusion: The decline combined news-driven risk trimming with a weekend-driven liquidity vacuum that magnified a futures-led liquidation cascade. Technical posture below key EMAs and a five-week losing streak skew near-term risk to the downside unless BTC reclaims the 200-day EMA.
Authors credited by the source: Daniel Francis
Published by Holder based on an external source.