

Forced liquidations push Bitcoin to $67,568, lowest since August 19
Bitcoin fell to $67,568 on Binance, its lowest since August 19, as forced liquidations accelerated a sell-off. BTC trades at $68,772, down 6.7% in 24 hours and 9.1% in a week. Ether is down 5.5% and Solana 3.4%. Crypto markets lost about $150 billion in 48 hours.
BREAKING: Bitcoin falls below $69,000 and ETH nears $1,900 as selling pressure accelerates in crypto.
Crypto markets have now lost -$150 billion in 48 hours. pic.twitter.com/29QW0khxOh
— The Kobeissi Letter (@KobeissiLetter) November 13, 2026
CoinGlass data show roughly $1.4 billion in liquidations over 24 hours, close to 90% from long positions. The cascade pushed BTC through $70,000 within about two hours. The Crypto Fear & Greed Index fell from 28 to 20, the first Extreme Fear reading since July.
Liquidation Cascade: The Overnight Flush Hit Longs 11 to 1
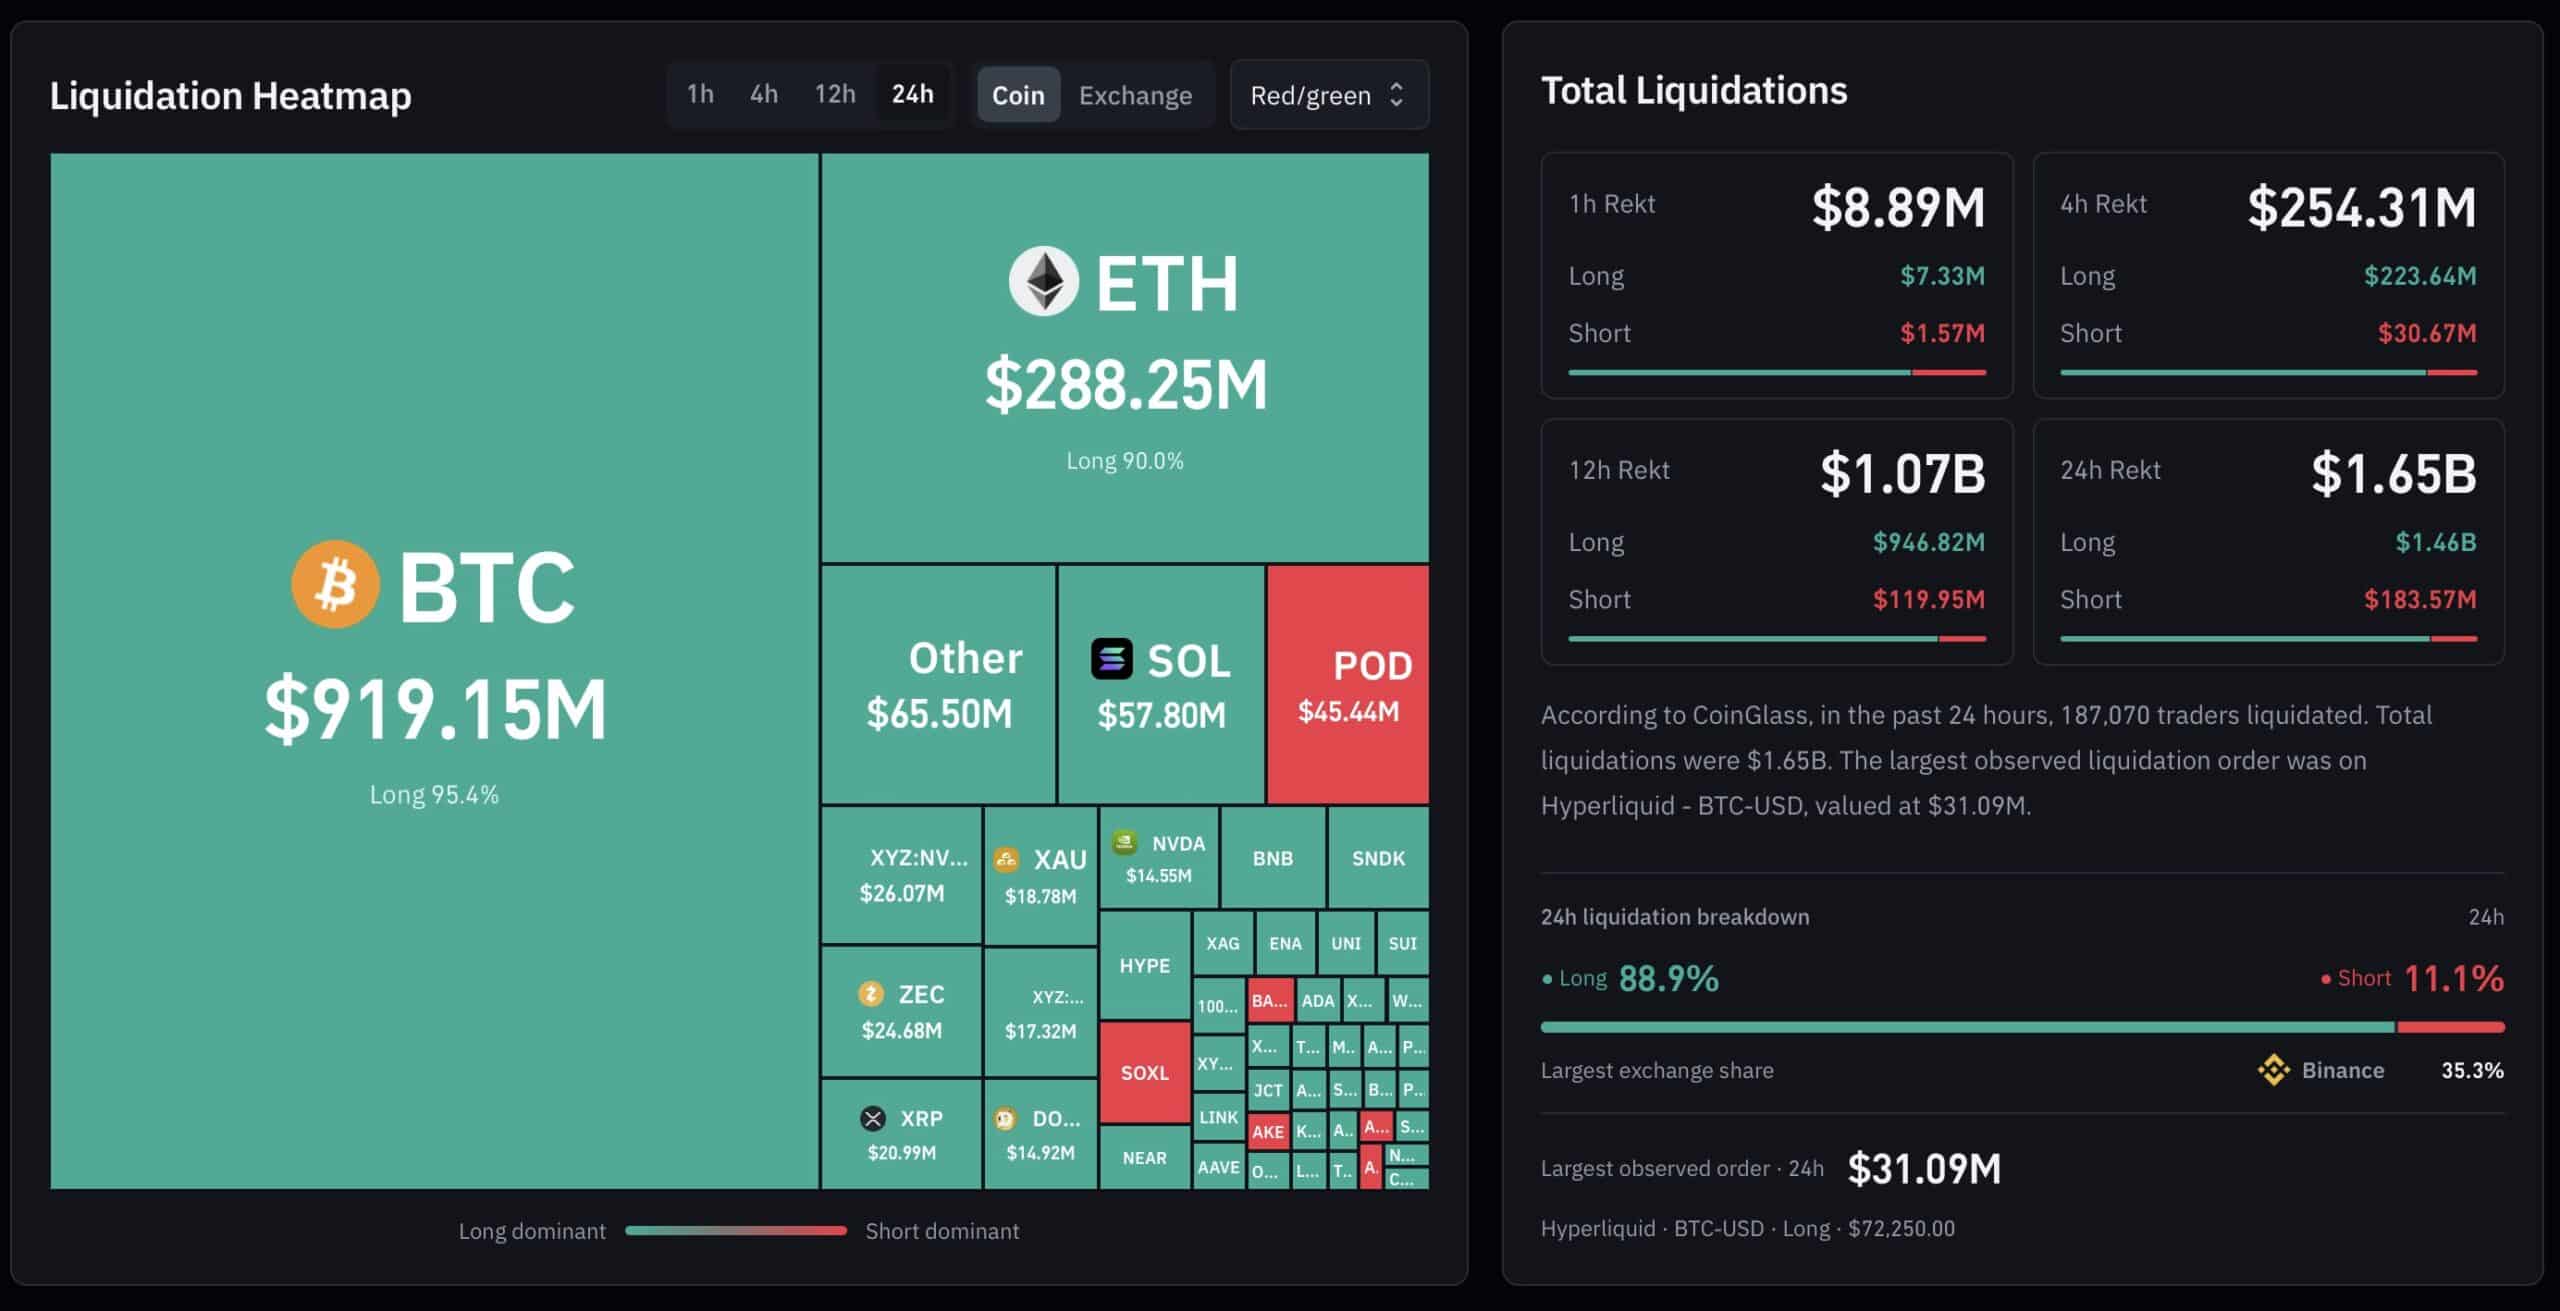
Liquidation Map
The sell-off accelerated after BTC broke below Tuesday’s $72,727 low. On OKX over the past 24 hours:
- Longs lost $125.5 million. Shorts lost $11.2 million. Longs took about 11 times more losses.
- Bitcoin: $76.7 million in long liquidations, concentrated around 14:00 UTC Thursday and 03:00 UTC Friday as BTC fell through $69,000.
- ETH: $33.6 million in long liquidations.
Outflows from U.S. spot Bitcoin ETFs added to selling pressure.
Bitcoin Futures Signals: Funding Flips Negative, Open Interest Falls
- Funding turned negative: OKX funding rate flipped to -0.0064% at 08:00 UTC. Shorts now pay longs.
- Open interest fell: OKX BTC futures OI declined from $3.86 billion to $3.46 billion, down 10% in hours.
- Fear at 20: Approaches the teens that marked prior capitulations, but above February and July lows at 9 and 11.
Positioning still shows high dip-buying: on OKX, 3.19 accounts are long for each short, little changed from before the drop.
Extreme Fear: Timing Risk Remains Elevated
Since 2018, the first drop to 20 or lower after a month without such a reading led to further declines in 15 of 16 cases. Median additional drawdown: 23.2%. Median time to low: 44 days. The low arrived within a week in three instances: August 2018, March 2020, September 2021.
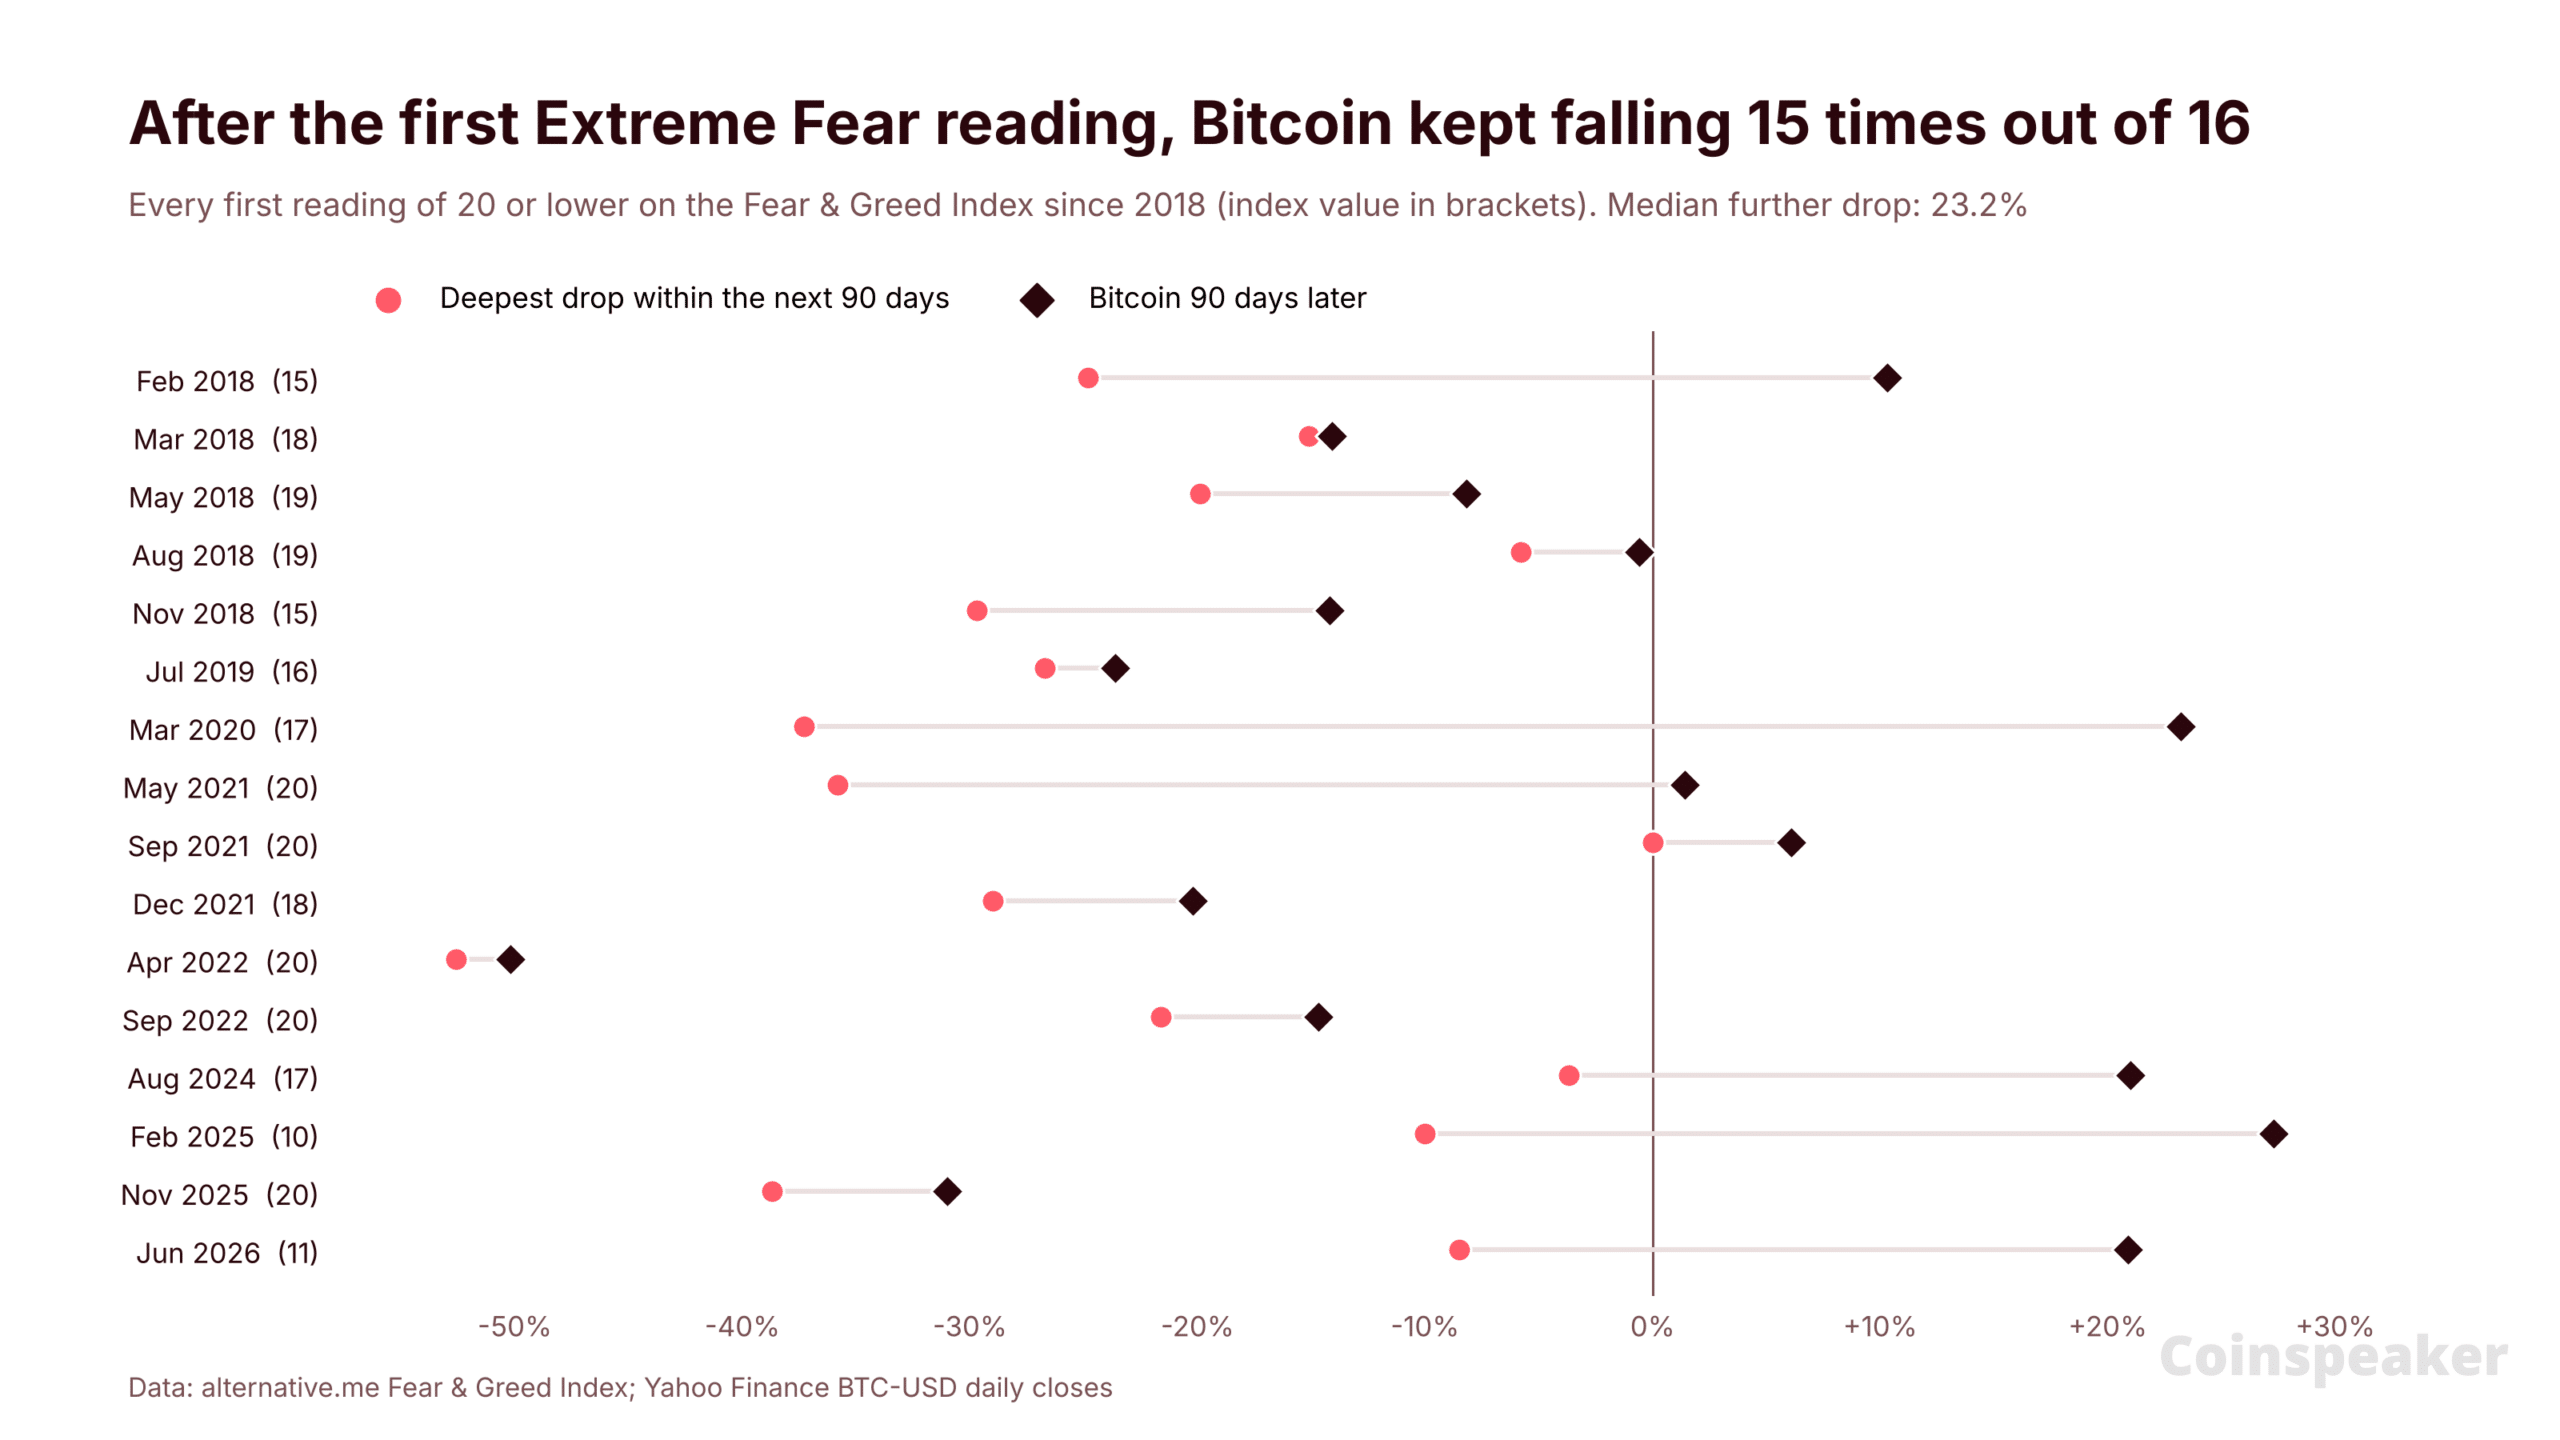
In June–July 2026, Extreme Fear at 20 preceded another 8.5% drop to $57,800 before a rally to $87,396 in September. Current readings suggest proximity to a low, not confirmation of it.
Daily Chart: Key Levels
BTC trades below the 50-day EMA at $78,226 and the 200-day EMA at $76,325.
- Resistance: $72,727, then $76,325.
- Support: $67,568. Below: $64,166 and $62,535.
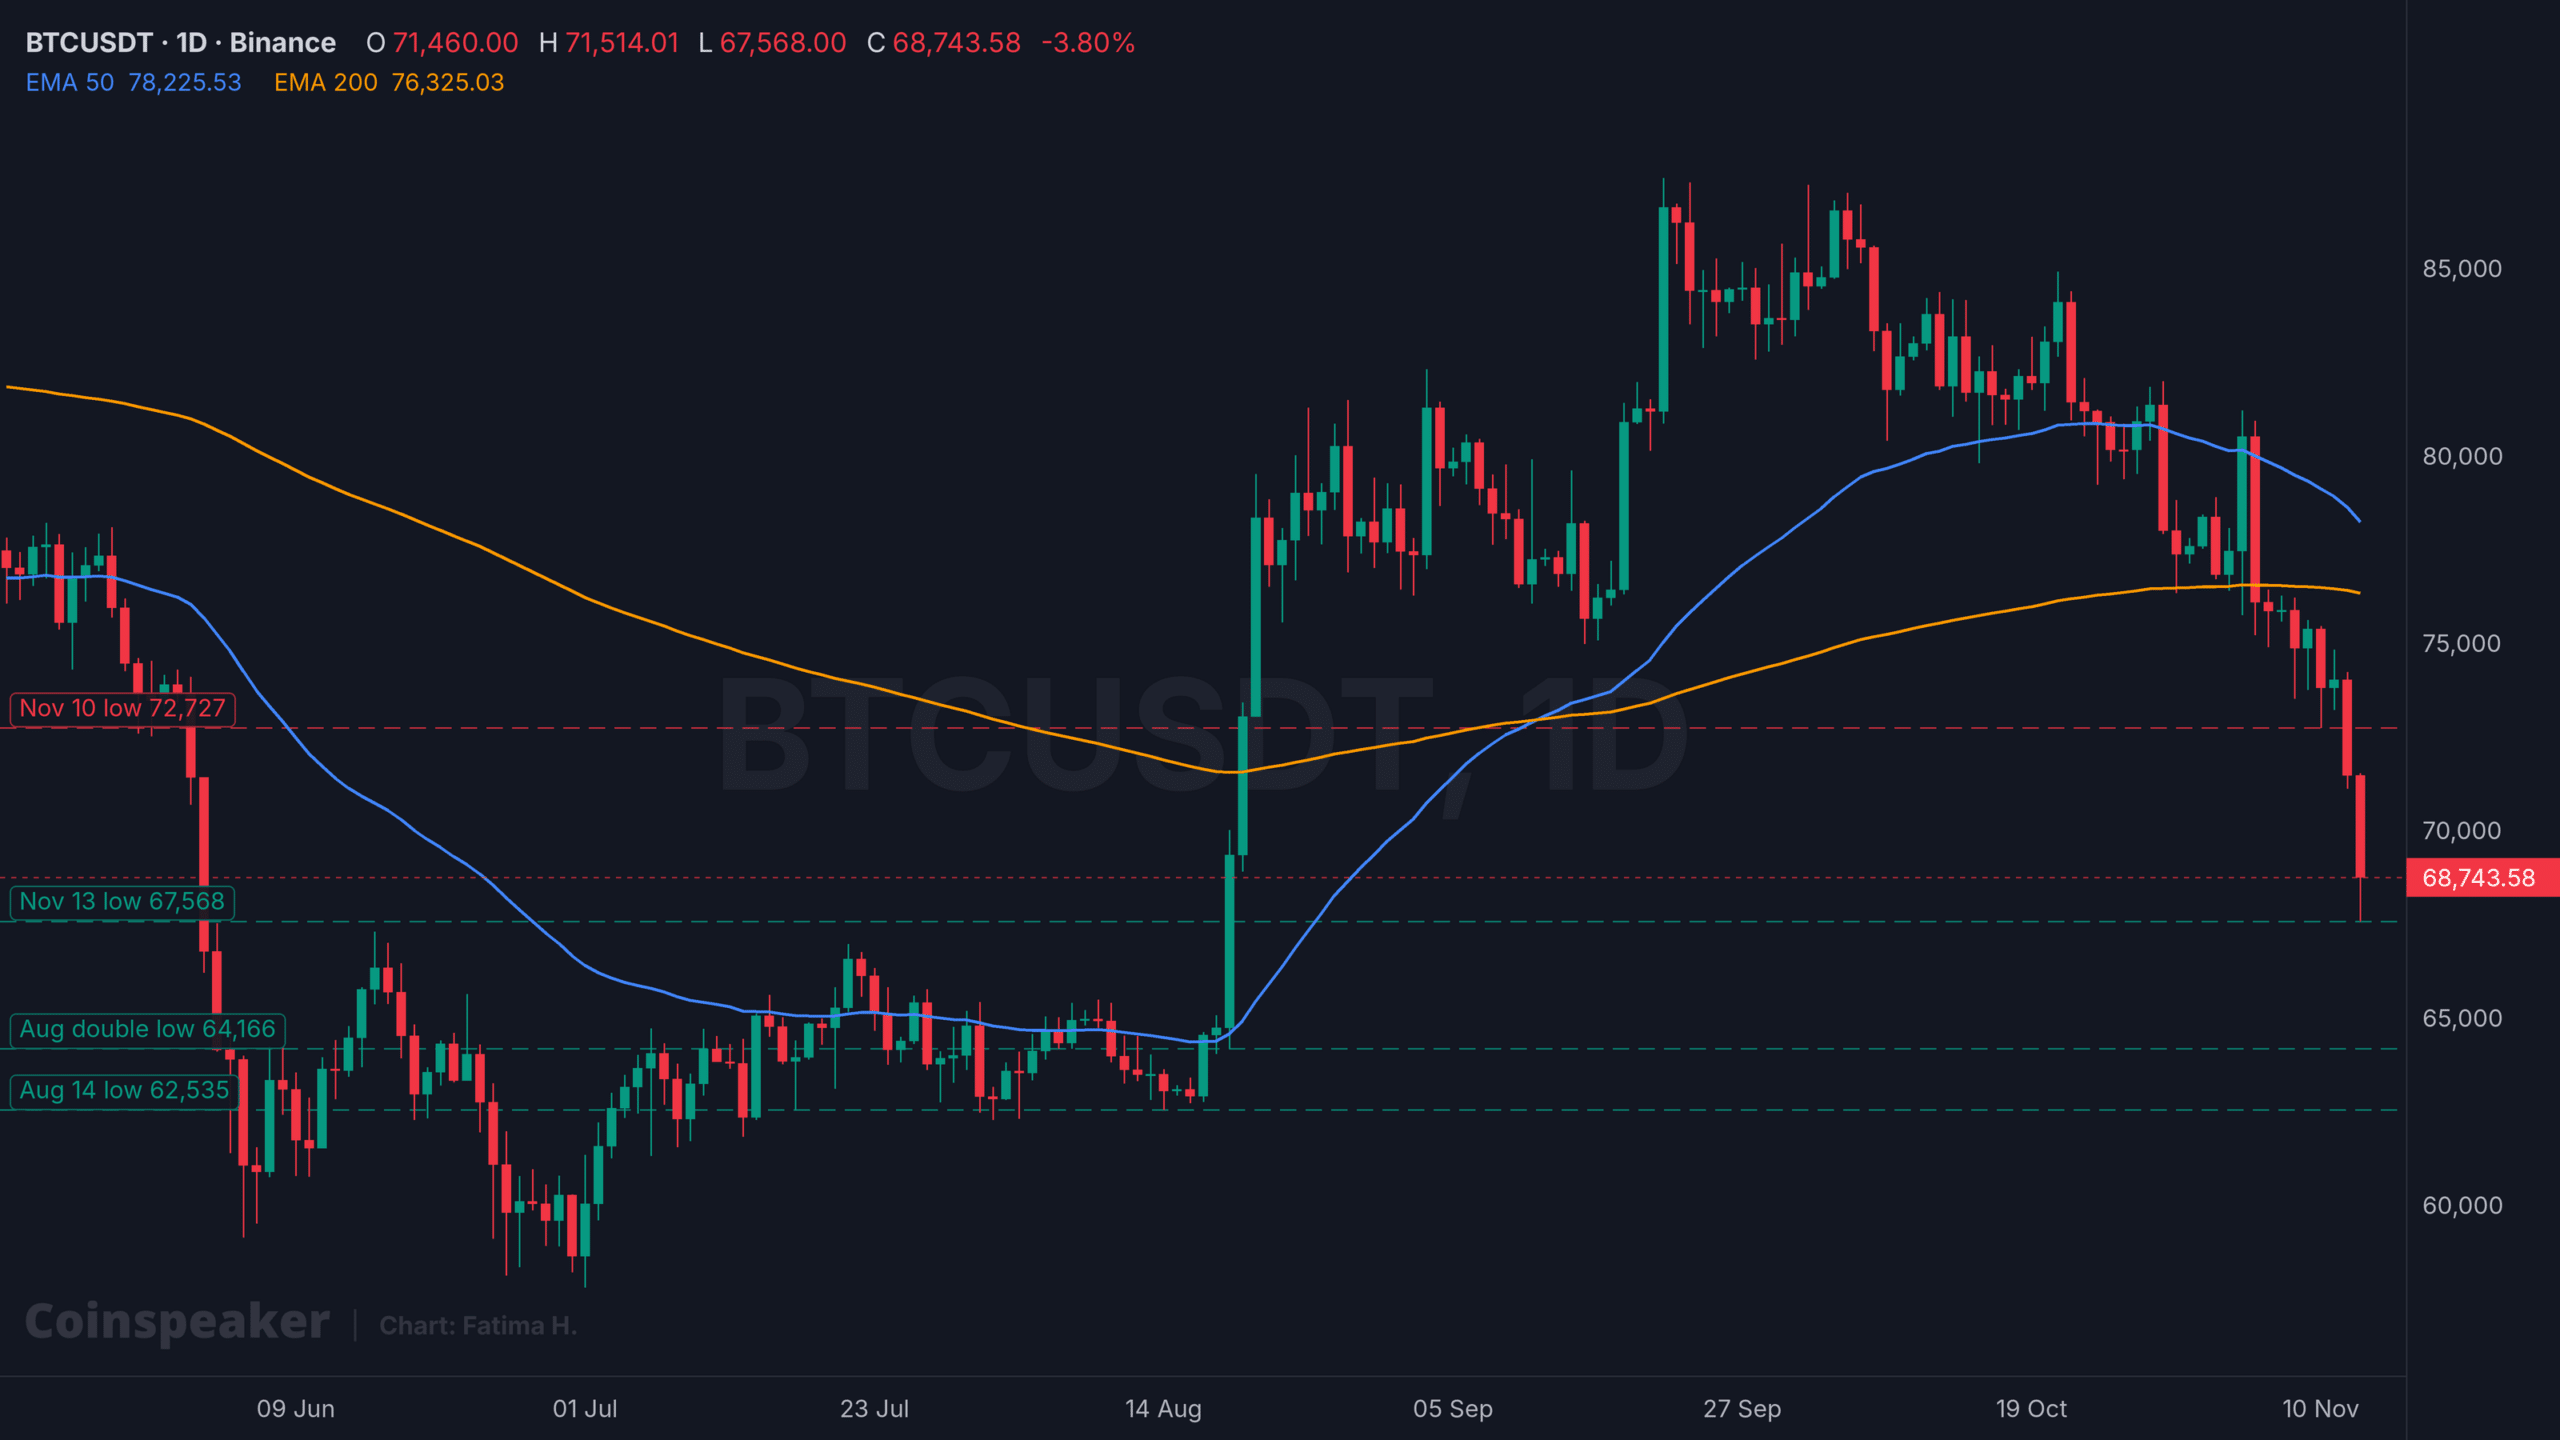
BTCUSDT 1D chart. Source: TradingView
Weekly Chart: 200-Week EMA Test
The 200-week EMA at $69,555 is the key level. BTC trades slightly below it before Sunday’s close. In 2026, BTC spent 16 weeks below this level across two stretches, and both yearly lows formed during those periods.
- Resistance: $69,555, then $78,053, the 50-week EMA.
- Support: $65,000, then $60,000, and $57,800.
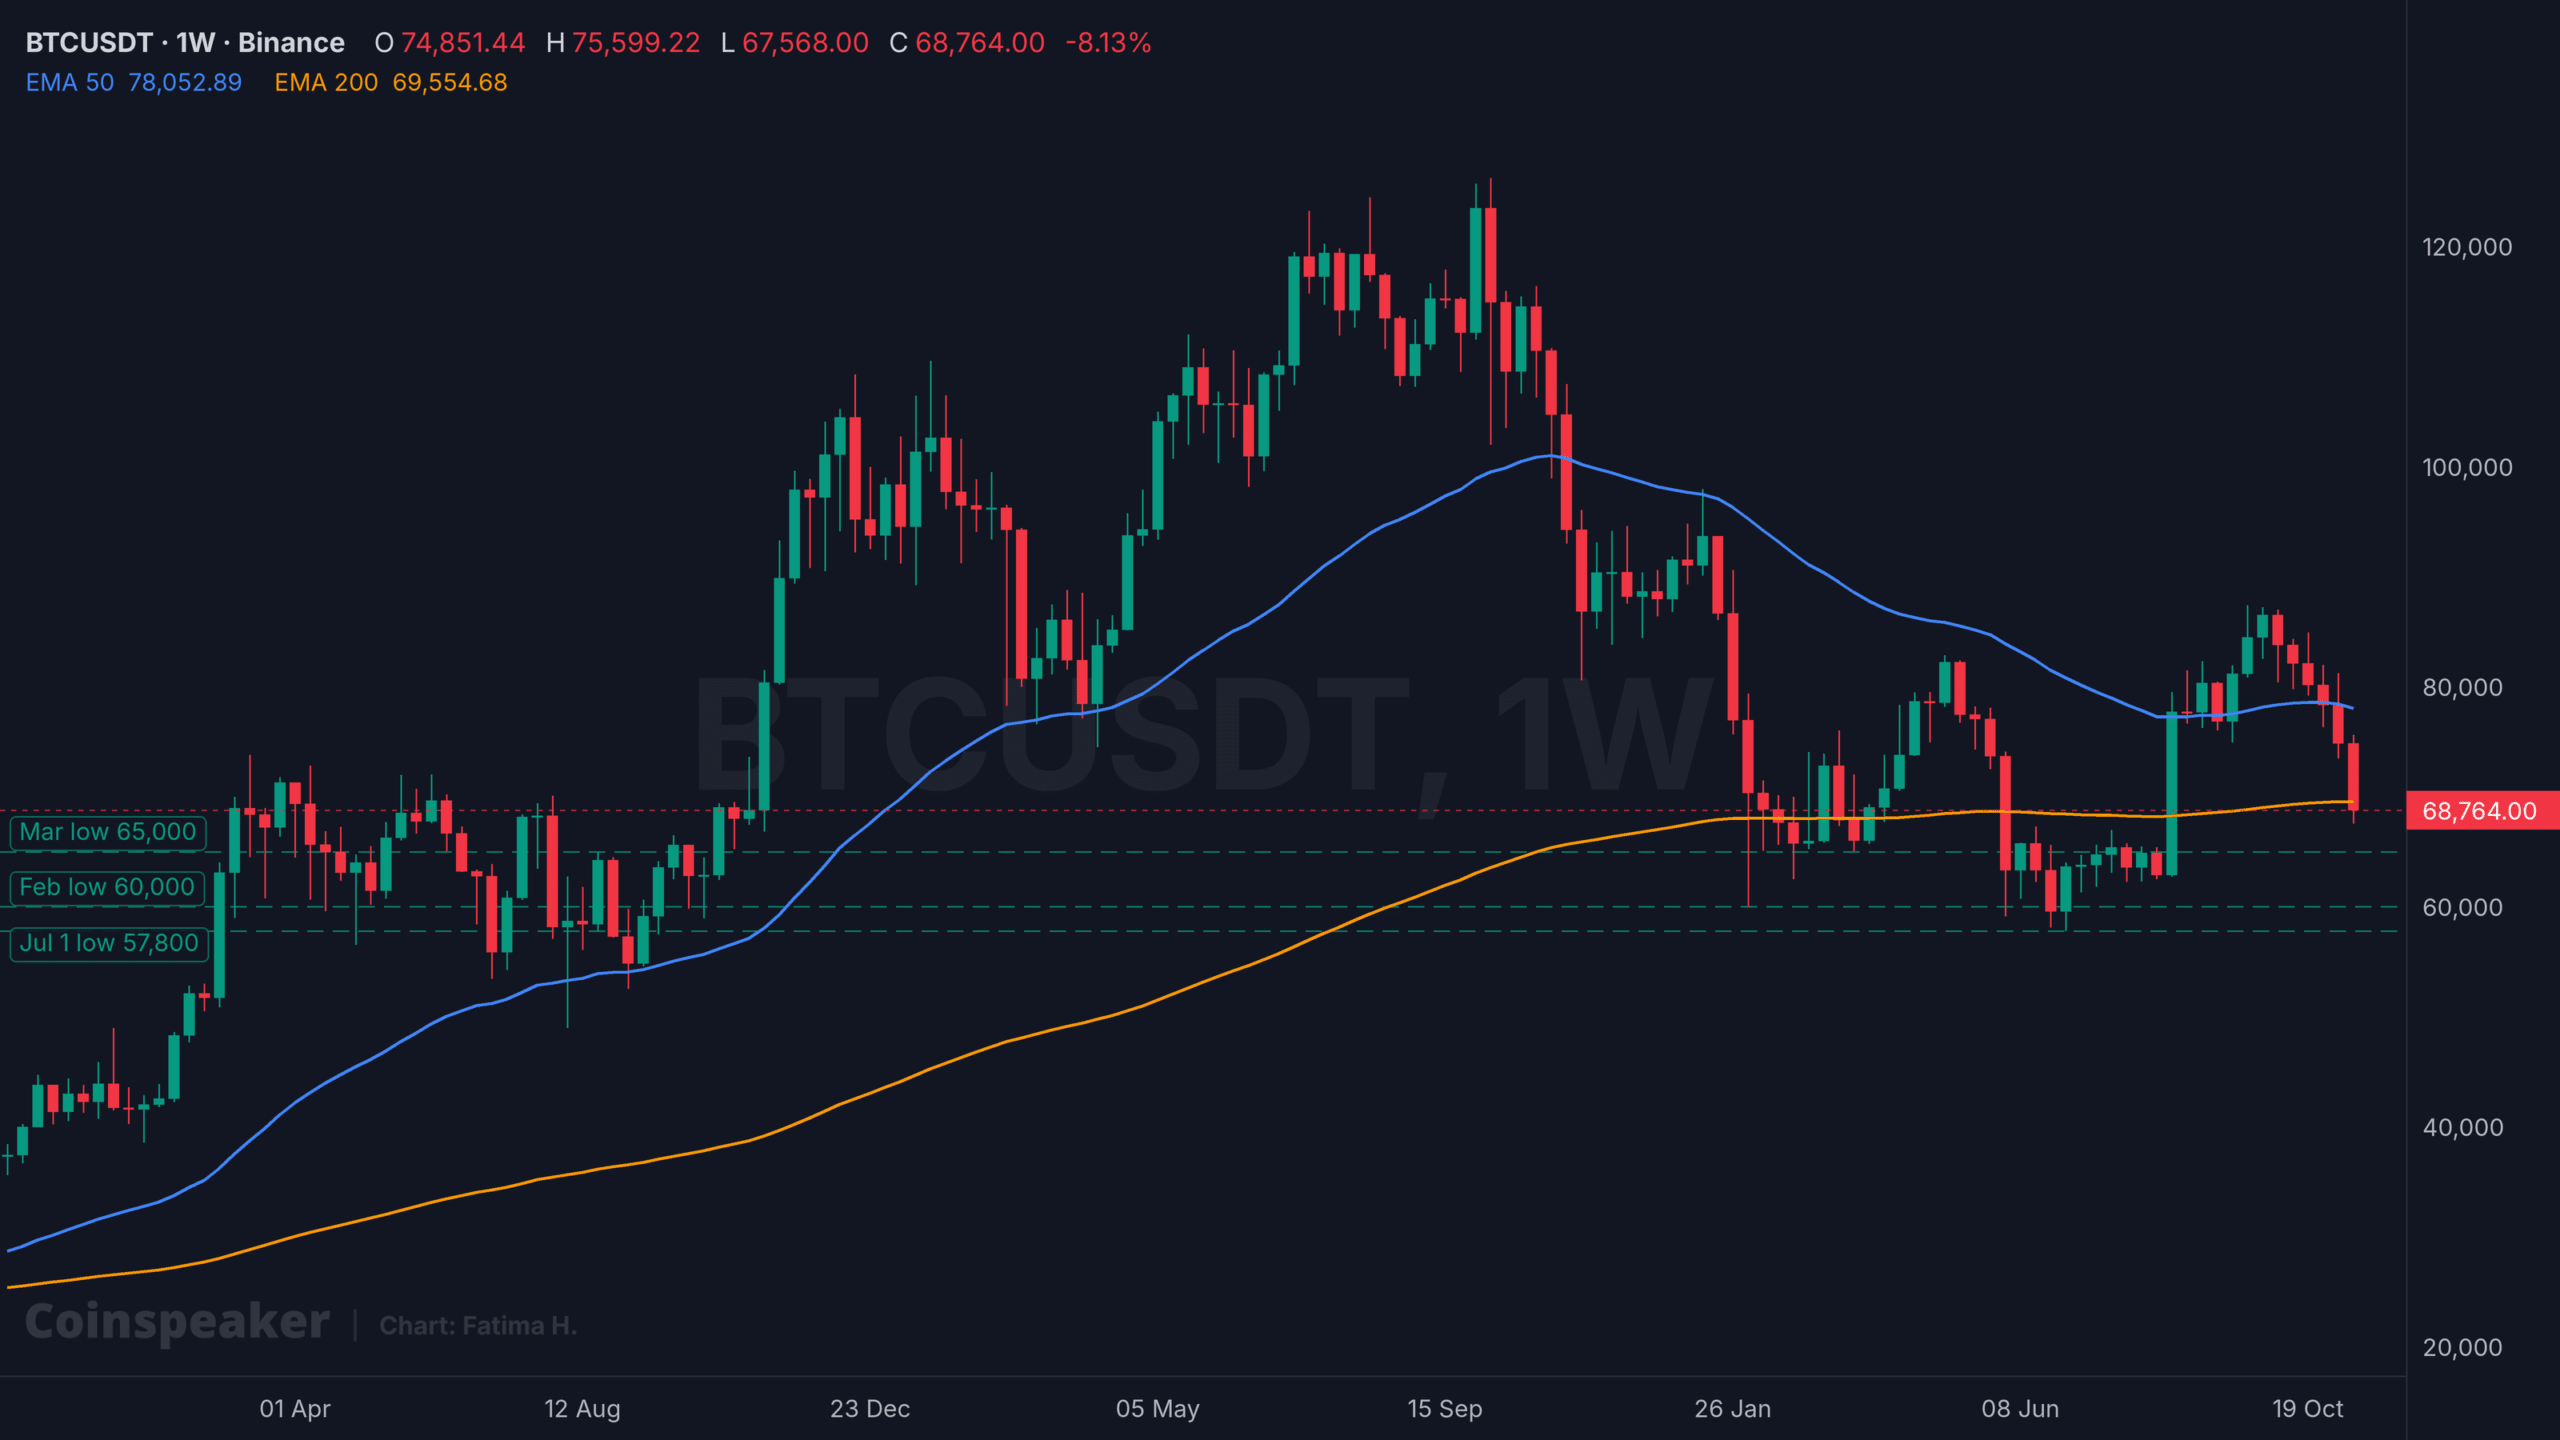
BTCUSDT 1W chart. Source: TradingView
Scenarios:
| Outlook | Trigger | Level to watch |
|---|---|---|
| Rebound | Weekly close back above $69,555 and daily close above $72,727 | $76,325, the 200-day EMA |
| Holding pattern | Daily closes between $64,166 and $72,727 | A base under the 200-week EMA |
| Sell-off | Daily close below $64,166 | $60,000, then $57,800 |
Leverage has been reduced and funding turned negative. The weekly close relative to $69,555 is the next inflection. Historical patterns indicate that first Extreme Fear readings often precede final lows by weeks.
Authors credited by the source: Daniel Francis
Published by Holder based on an external source.