18 0
Bitcoin Pullback Reflects 2017 Patterns, Analyst Says
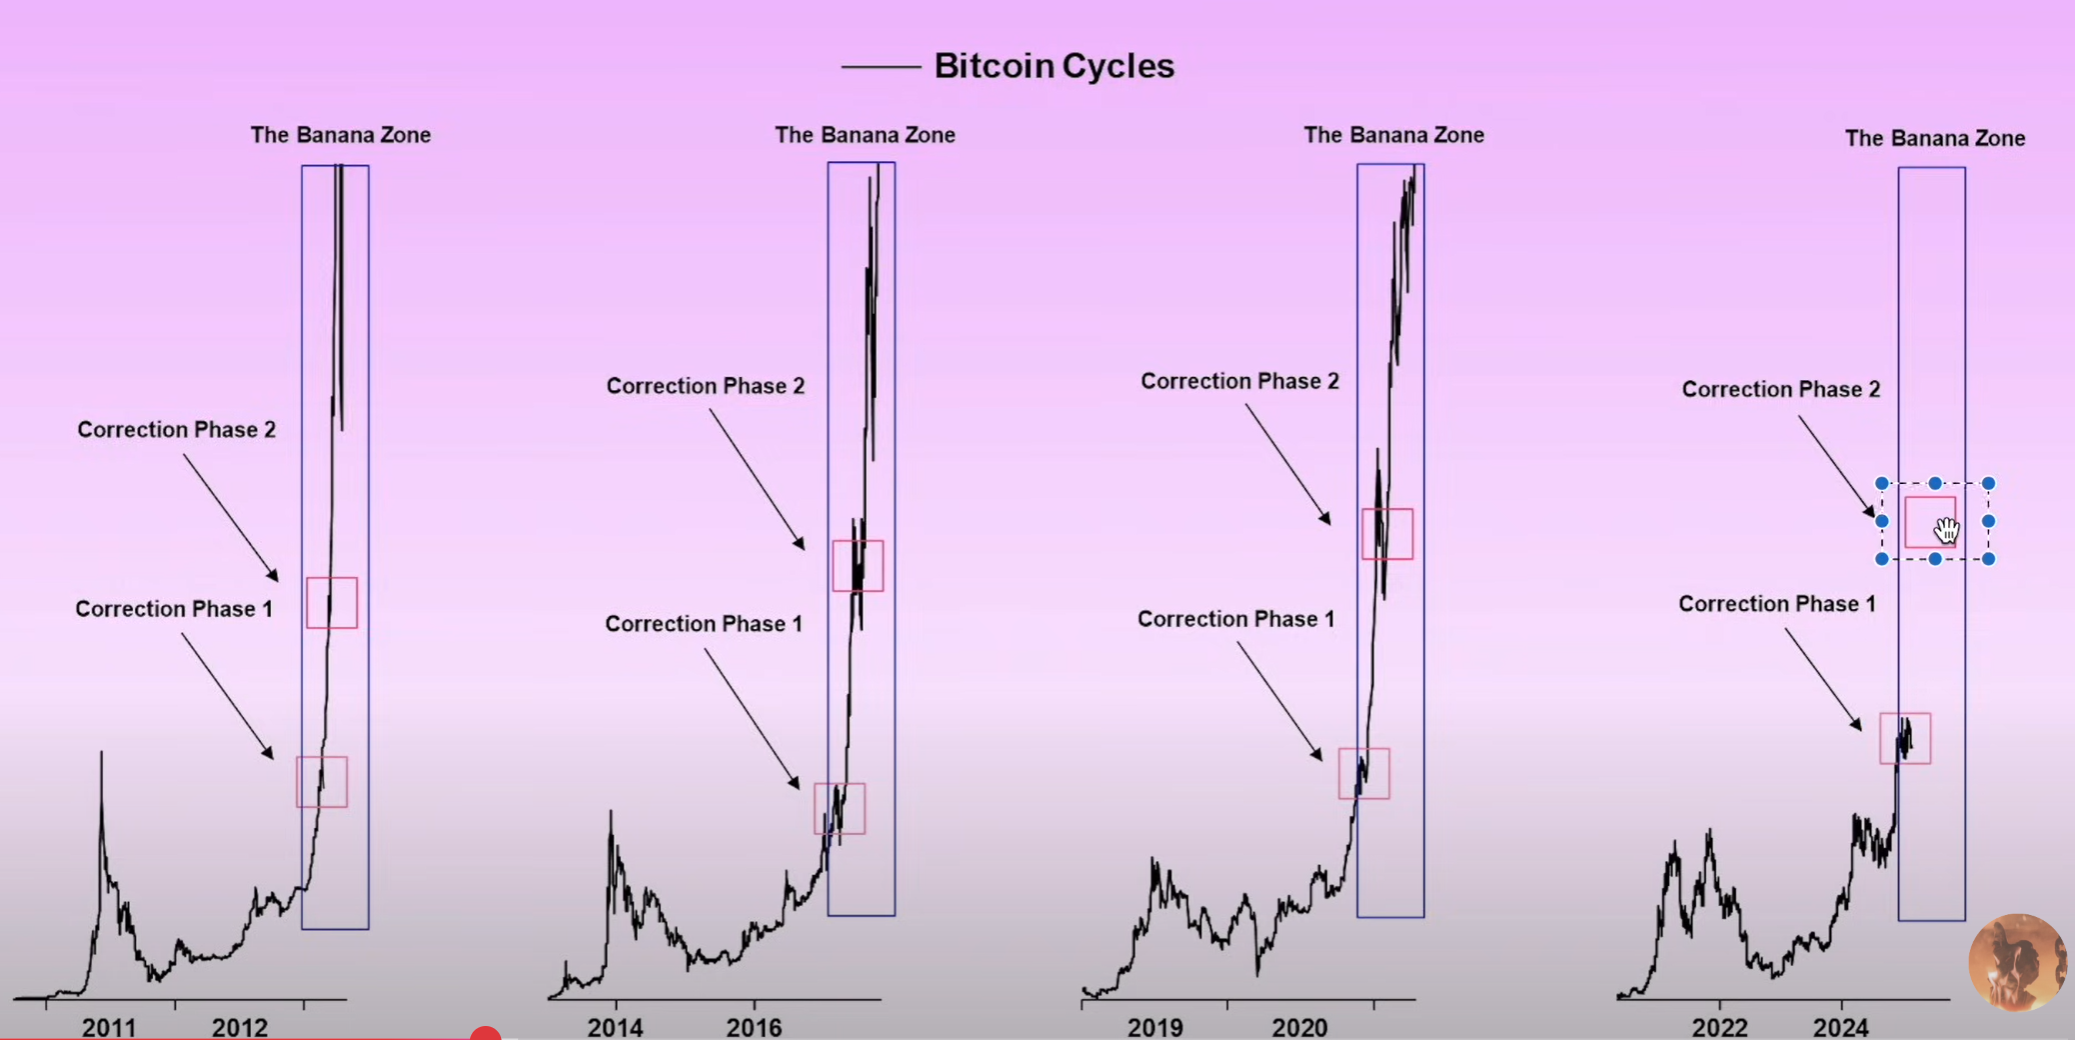
Rekt Capital analyzed Bitcoin's recent dip, likening it to the 2017 bull cycle with multiple corrections. His video update, titled “Where’s The Bitcoin ‘Banana Zone’? – An Update,” highlights the following key points:
- Current retracement is a natural and extended correction, still on track for future gains.
- Historical patterns show Bitcoin often experiences two or more corrective periods after new all-time highs.
- In the 2017 rally, pullbacks ranged from 34% to 40% before reaching peak prices.
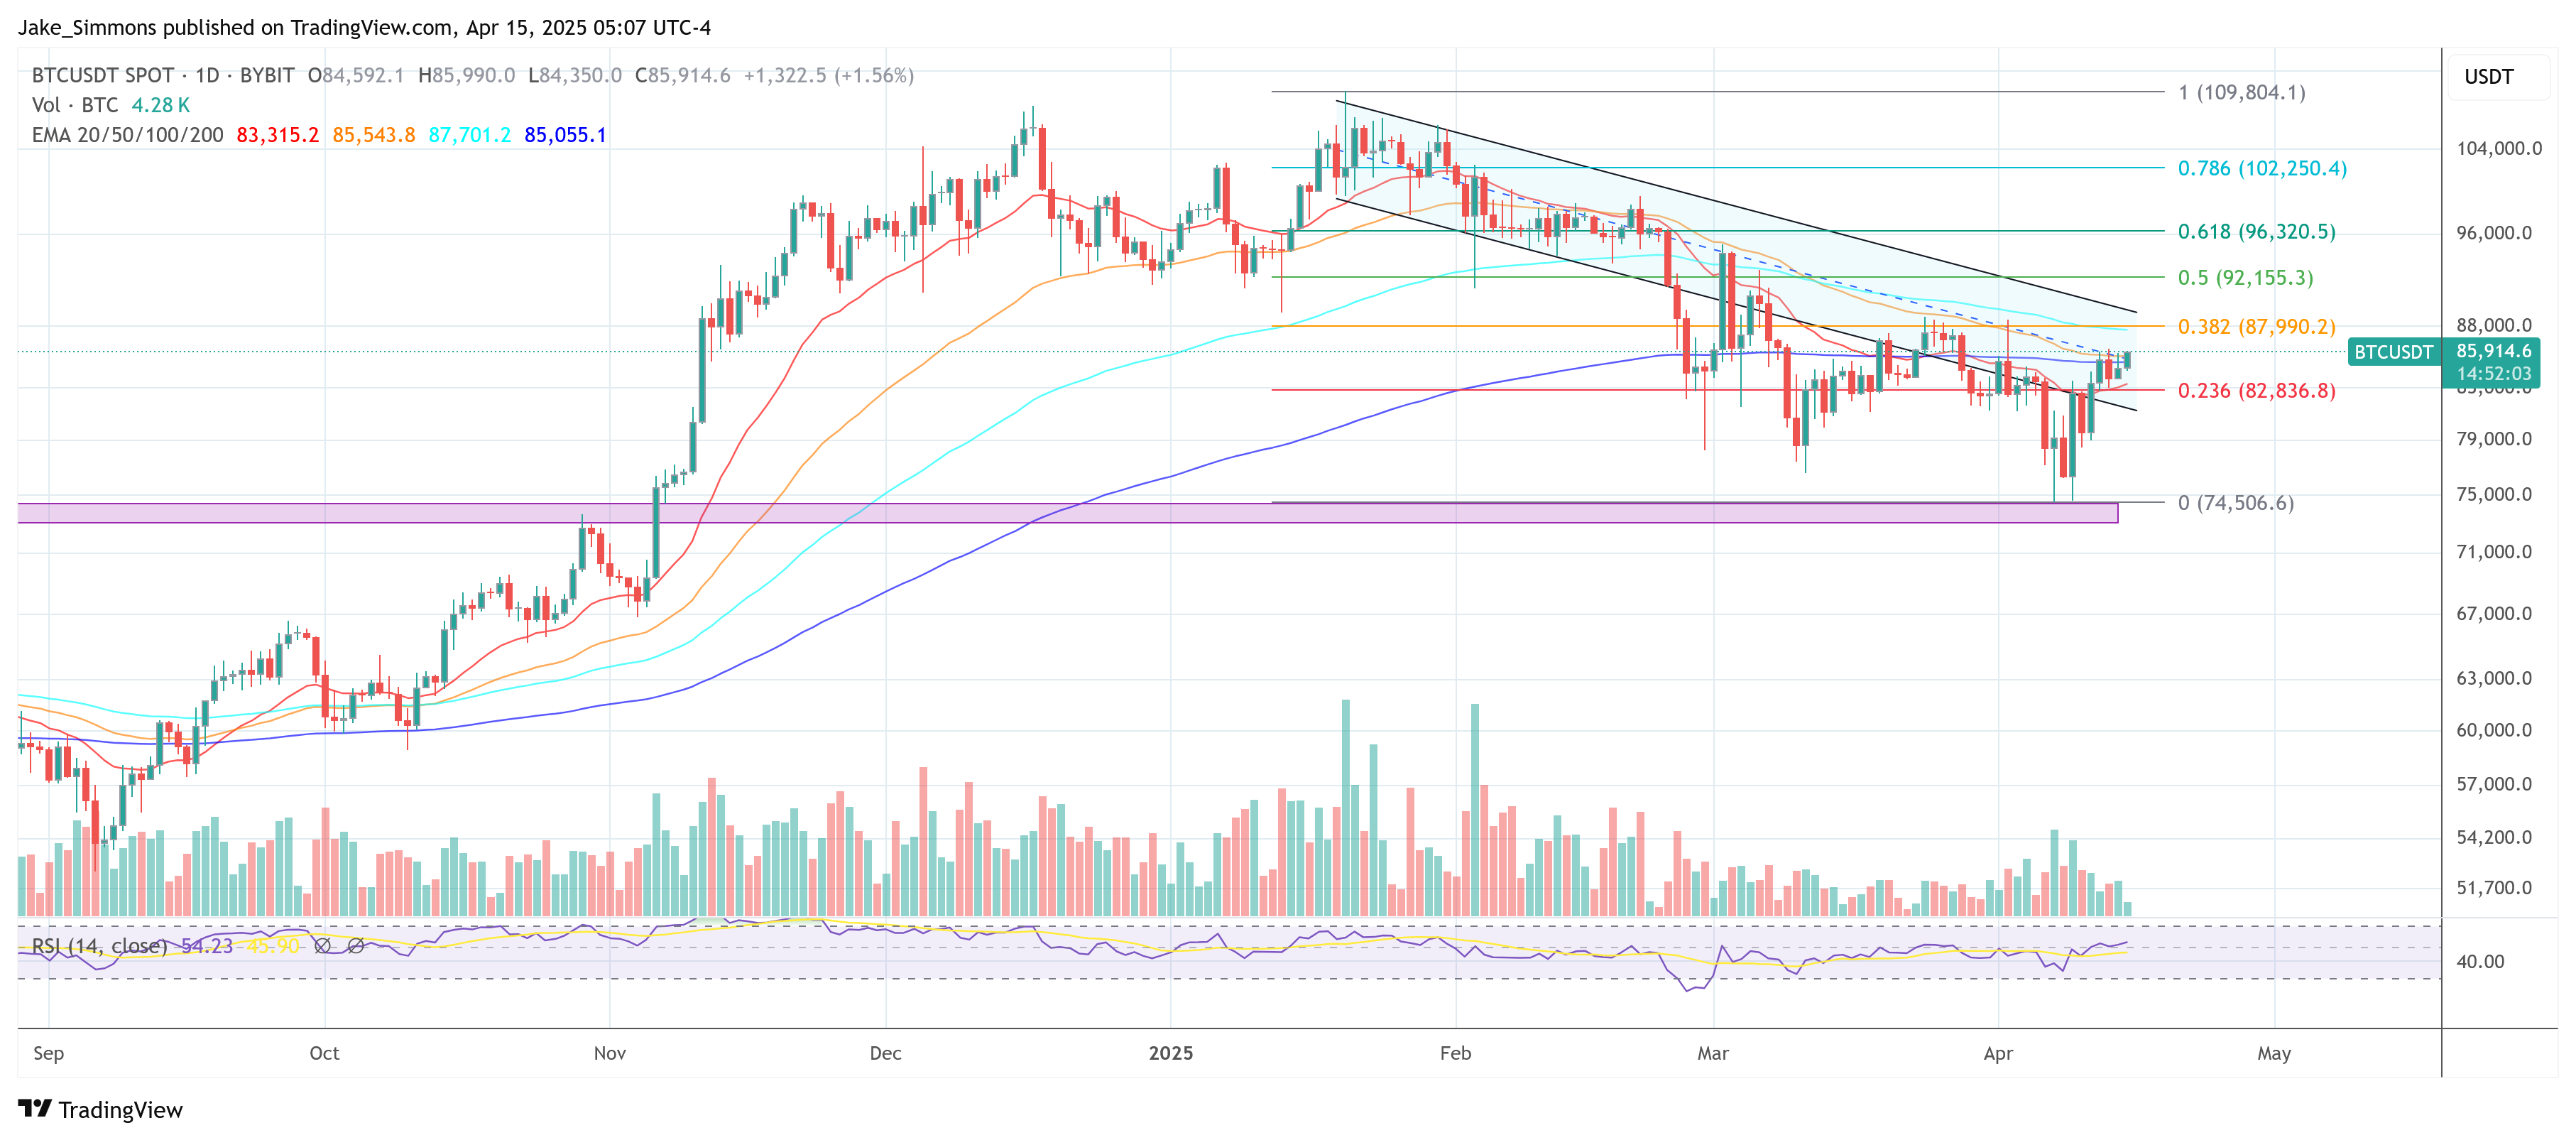
- Despite a current drawdown of 32%, further upside is anticipated after this correction.
- Bitcoin's price forms a triangular market structure between the 21-week and 50-week exponential moving averages.
- Similar formations in mid-2021 led to significant price movements.
- Market conditions do not indicate a bear cycle; corrections are viewed as part of a broader bullish framework.
- At press time, BTC traded at $85,914.