

US spot Bitcoin ETFs see $7.9M inflows after seven-day outflows
US spot Bitcoin ETFs ended a seven-day outflow streak with a net $7.9 million inflow on Monday, November 16. BlackRock’s iShares Bitcoin Trust (IBIT) accounted for all net buying with $76.5 million of inflows, while most other funds saw continued redemptions. Over the prior 11 sessions from October 30 to November 13, US spot Bitcoin ETFs shed approximately $2.99 billion as Bitcoin fell about 20% to trade near $65,000 on Tuesday.
IBIT drew inflows while peers continued to see outflows
IBIT recorded $76.5 million, its first inflow since October 29, after 11 straight outflow sessions totaling about $2.35 billion. Seven of the other 11 spot Bitcoin ETFs had outflows and four were flat:
- Grayscale GBTC: -$34.6 million
- Fidelity FBTC: -$11.3 million
- Grayscale mini BTC fund: -$6.6 million
- Invesco, ARK, Franklin, Morgan Stanley funds: -$16.1 million combined
Since launch in January 2024, US spot Bitcoin ETFs have accumulated $54.7 billion of net inflows, averaging about $76.5 million per day. Monday’s net +$7.9 million is small relative to history.
Bitcoin Spot ETFs See $7.99M in Net Inflows, Ethereum ETFs Record $8.31M in Outflows
According to SoSoValue, on November 16 (ET), U.S. spot Bitcoin ETFs recorded net inflows of $7.99 million, led by BlackRock's IBIT with $76.5 million in inflows. Spot Ethereum ETFs saw net… pic.twitter.com/BEltRhW0hi
— Wu Blockchain (@WuBlockchain) November 17, 2026
Flow context and price reaction
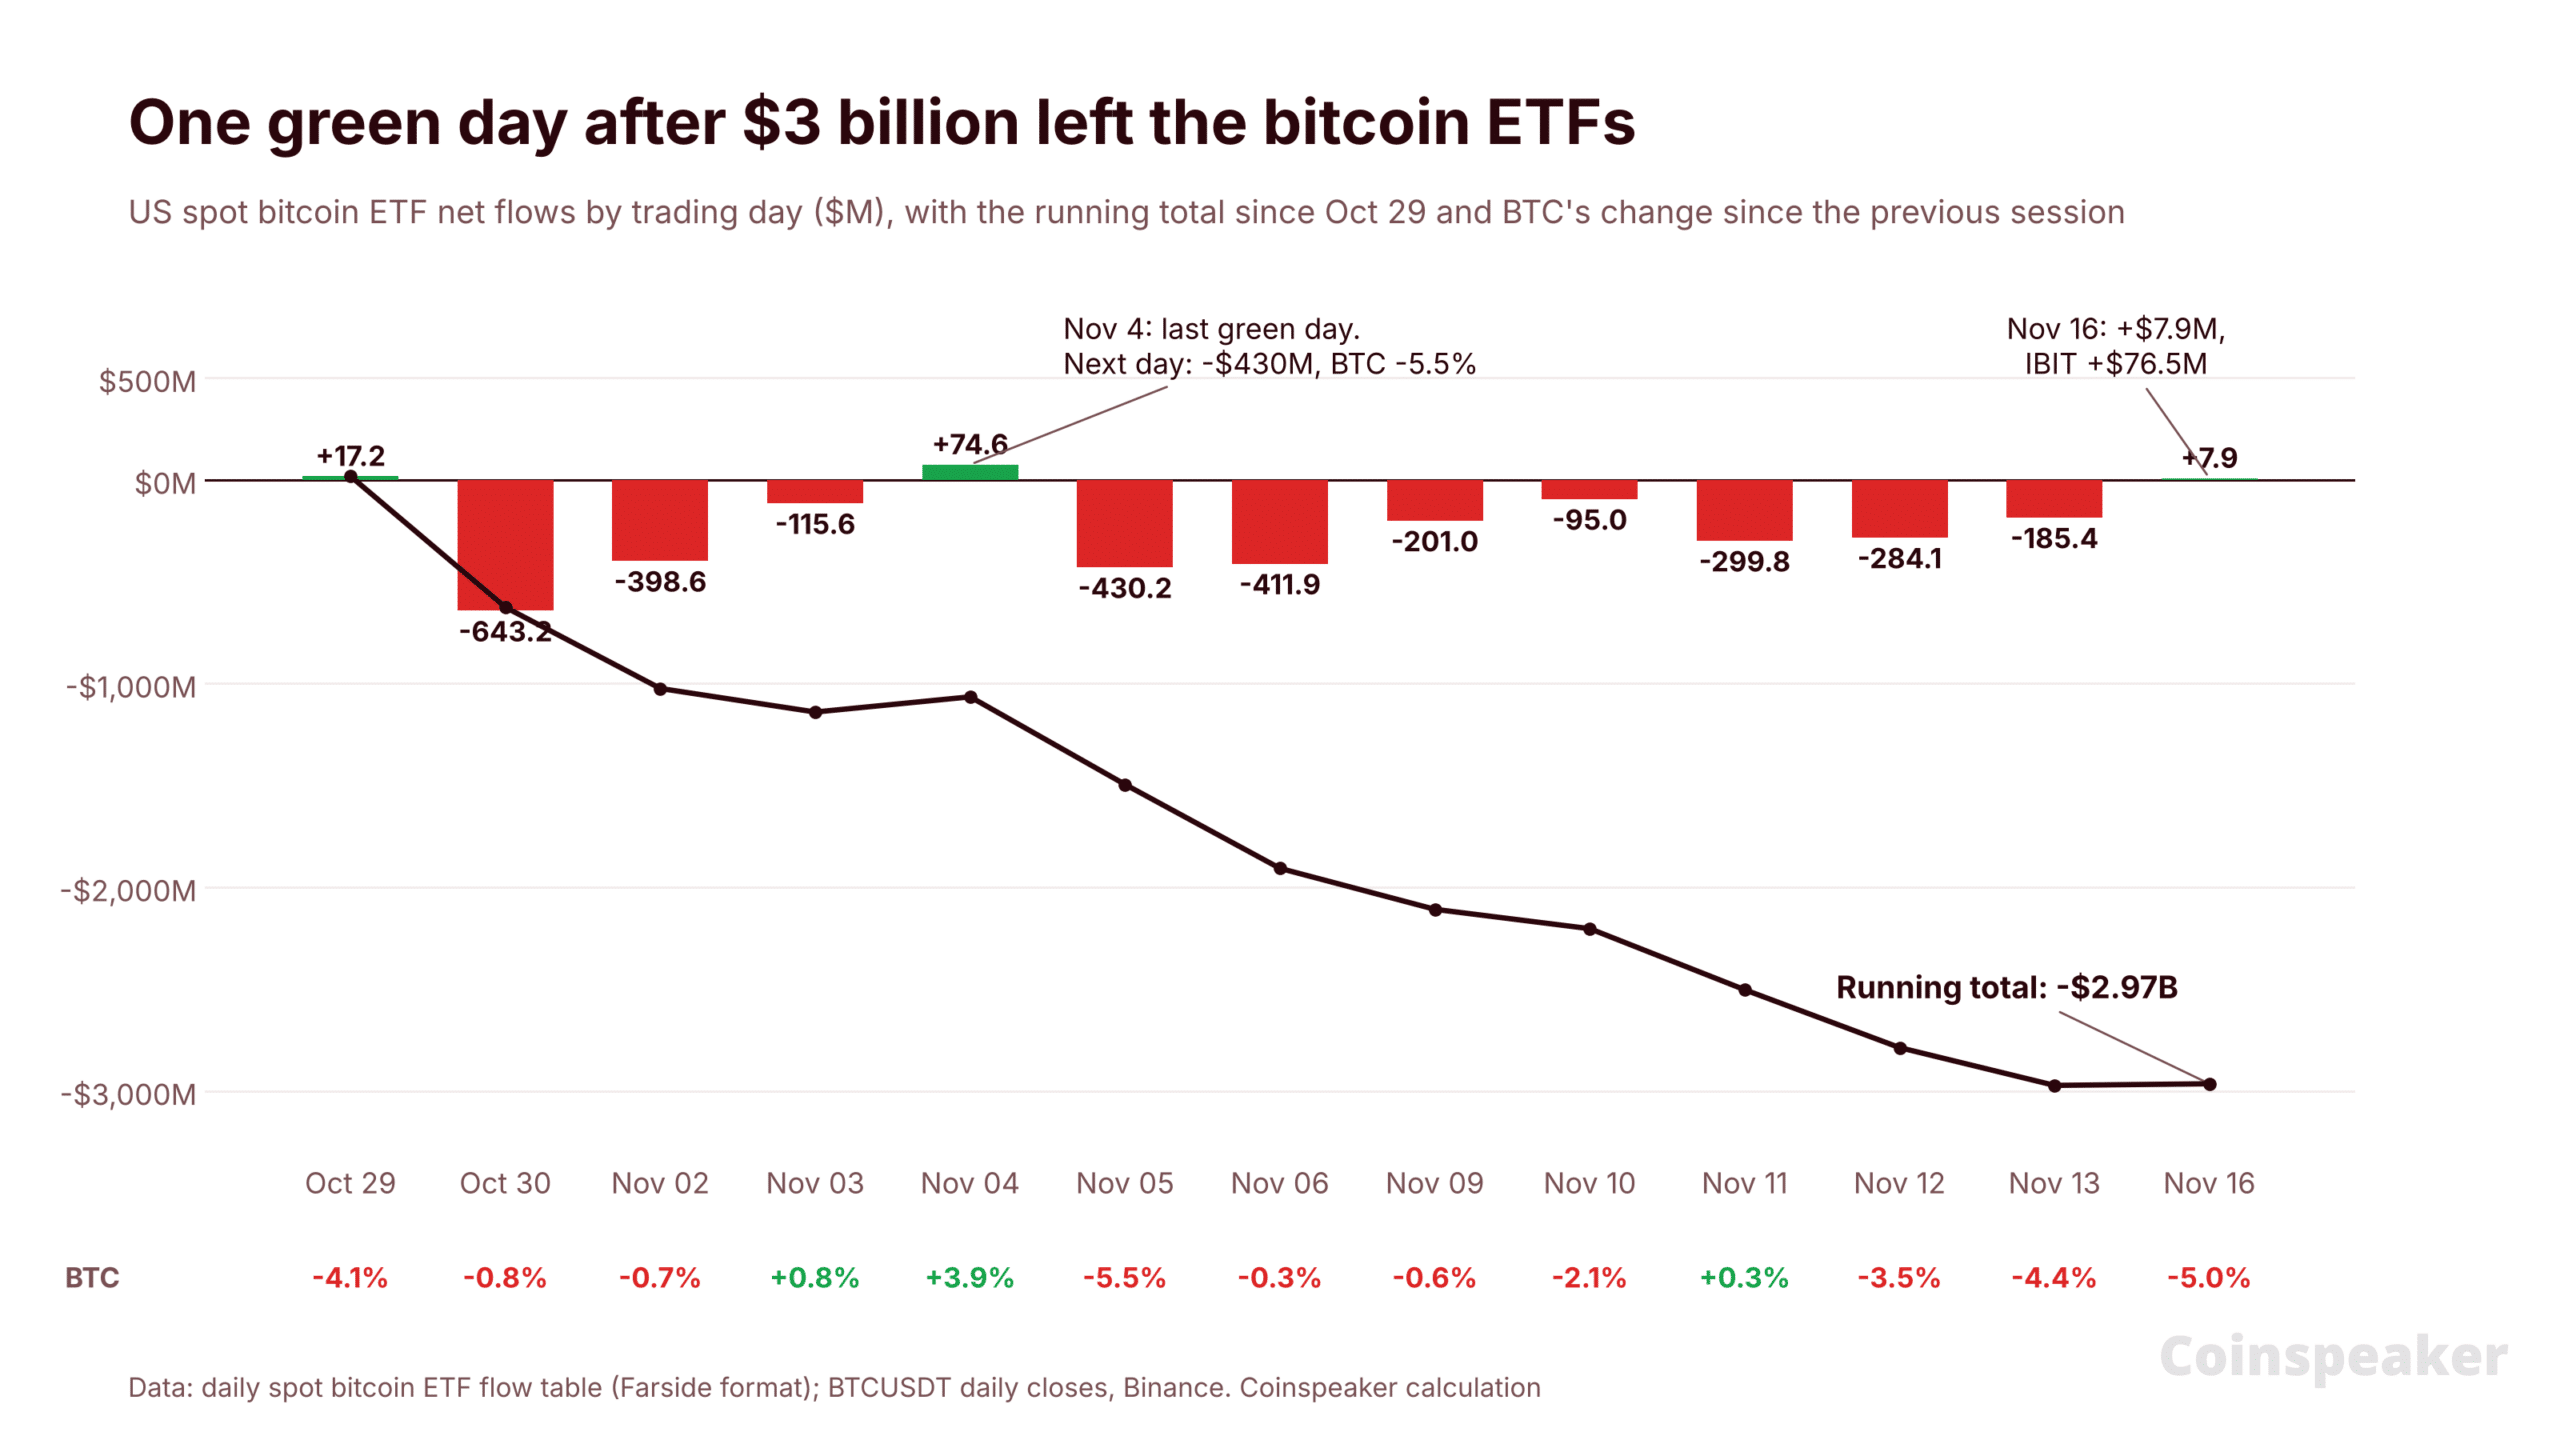
- Cumulative since Oct 29: -$2.97 billion. Monday recouped 0.3% of that.
- November 4: +$74.6 million inflow and a 3.9% BTC rise to $80,504, followed by -$430 million outflow and a 5.5% drop the next day.
- Outflow-heavy sessions: BTC fell on eight of ten red-flow days, including -3.5% on November 12 and -4.4% on November 13.
- Timing: Monday’s inflow followed a weekend drop. BTC closed 5.0% below Friday’s close.
Inference: one modest green-flow day aligns with dip-buying rather than a confirmed trend change.
Upcoming catalysts
- Nvidia earnings: post-market Tuesday. A miss could pressure tech and correlated crypto.
- Anthropic IPO: expected Thursday on Nasdaq. Large listings can divert risk capital.
- Federal Reserve: market-implied expectation of a rate hike at the December 8–9 FOMC meeting. Higher short rates typically weigh on non-yielding assets like Bitcoin.
Sentiment: Crypto Fear & Greed Index at 12, classified as extreme fear, up from 10 over the weekend.
BTC price levels
BTC trades at $64,974 on the daily chart. It is below the 50-day EMA at $76,233 and the 200-day EMA at $75,871.
- Resistance: $65,500 near-term. Above that: $74,300, a repeatedly tested level from March to September.
- Support: $62,300 with multiple bounces in 2026; a break previously extended to $57,800, the 1-year low.
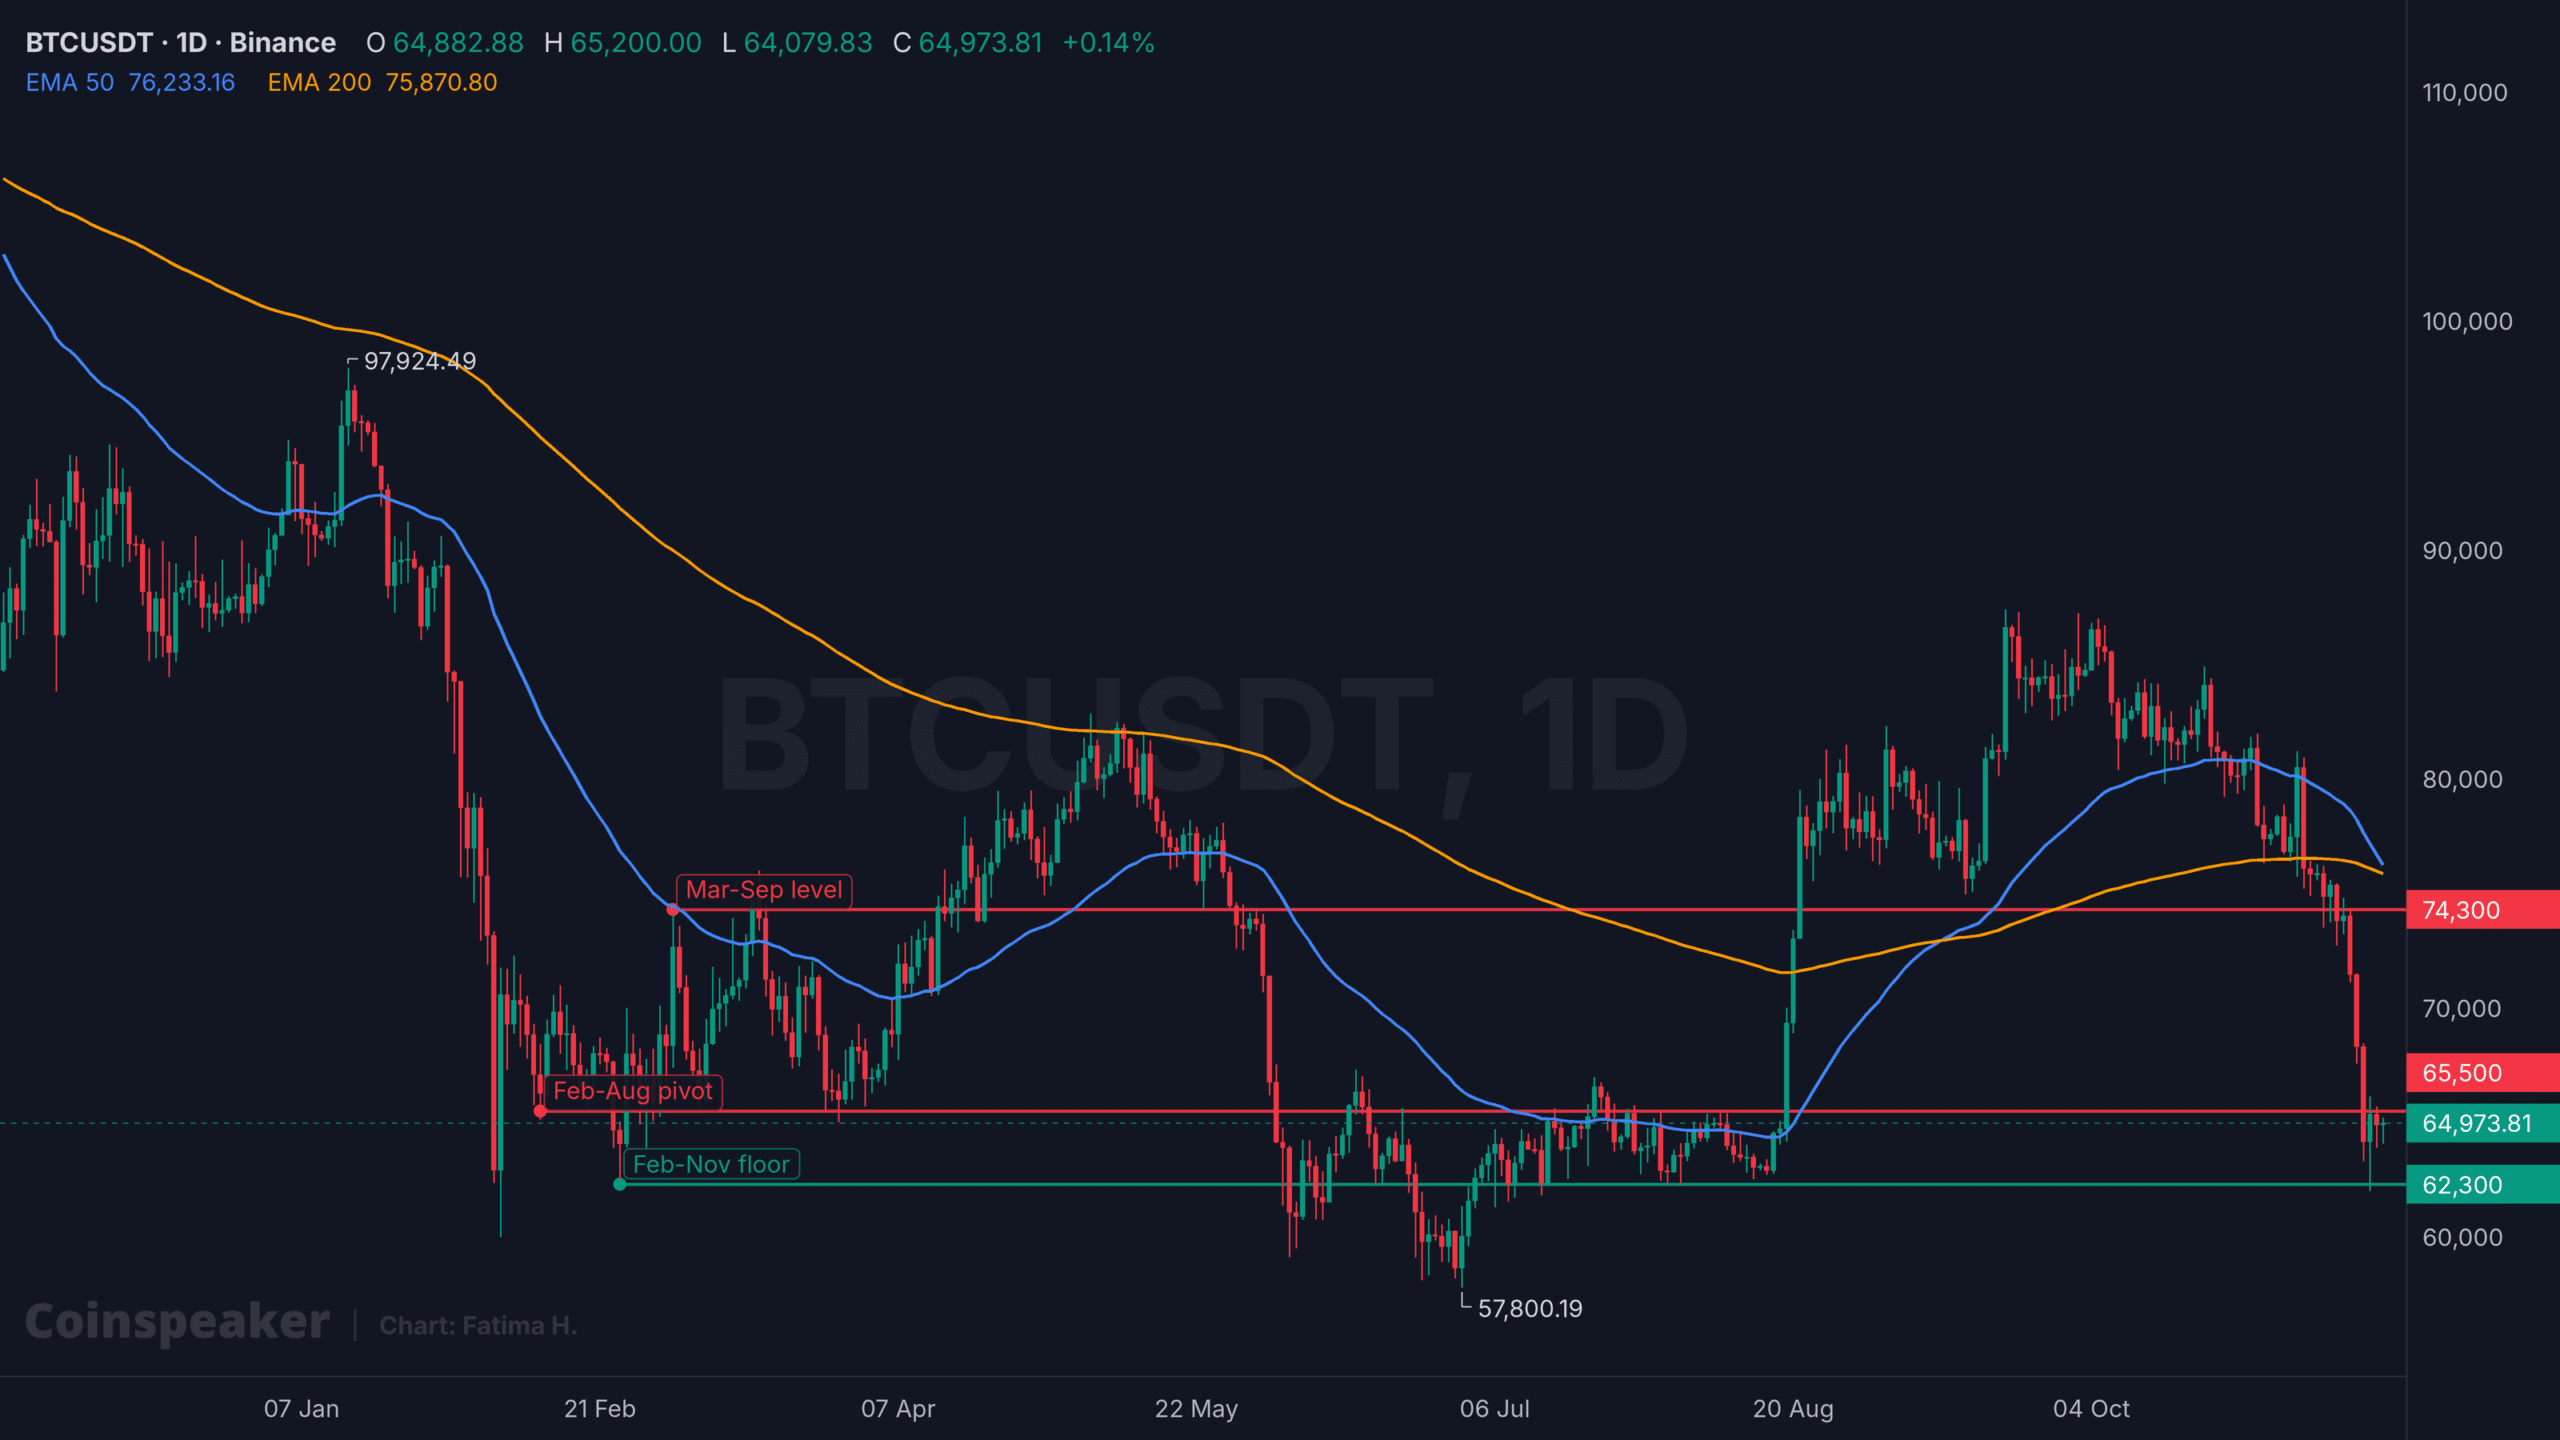
BTCUSDT 1D chart. Source: TradingView
Scenarios
| Outlook | Trigger | Level to watch |
|---|---|---|
| Rebound | Daily close above $65,500 with continued ETF inflows | $74,300 |
| Holding pattern | Mixed flows; price between $62,300 and $65,500 | Range into the Fed meeting |
| Sell-off | Daily close below $62,300 with renewed outflows | $57,800 |
Conclusion: Monday’s net inflow, concentrated in IBIT, is insufficient to confirm a trend reversal. Sustained inflows and a close above $65,500 would strengthen the rebound case, while negative macro surprises or renewed ETF redemptions would keep downside risk elevated.
Authors credited by the source: Daniel Francis
Published by Holder based on an external source.