Analyst sees 10% move as Solana nears triangle apex
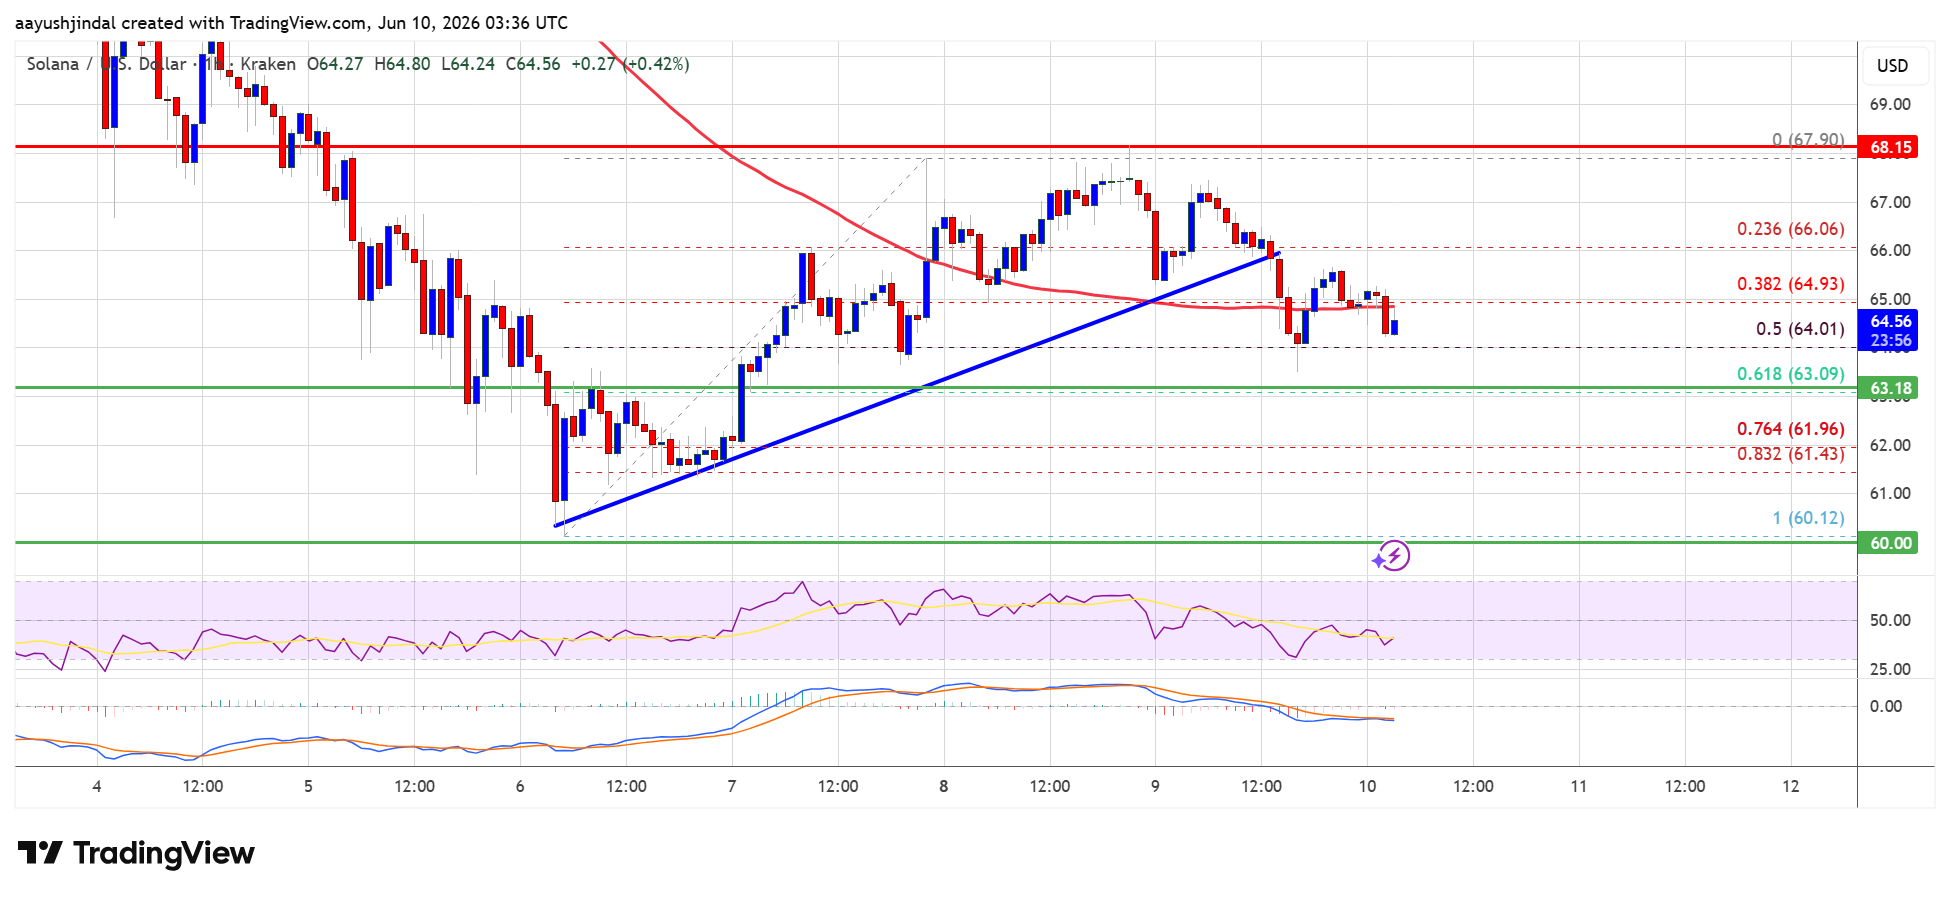
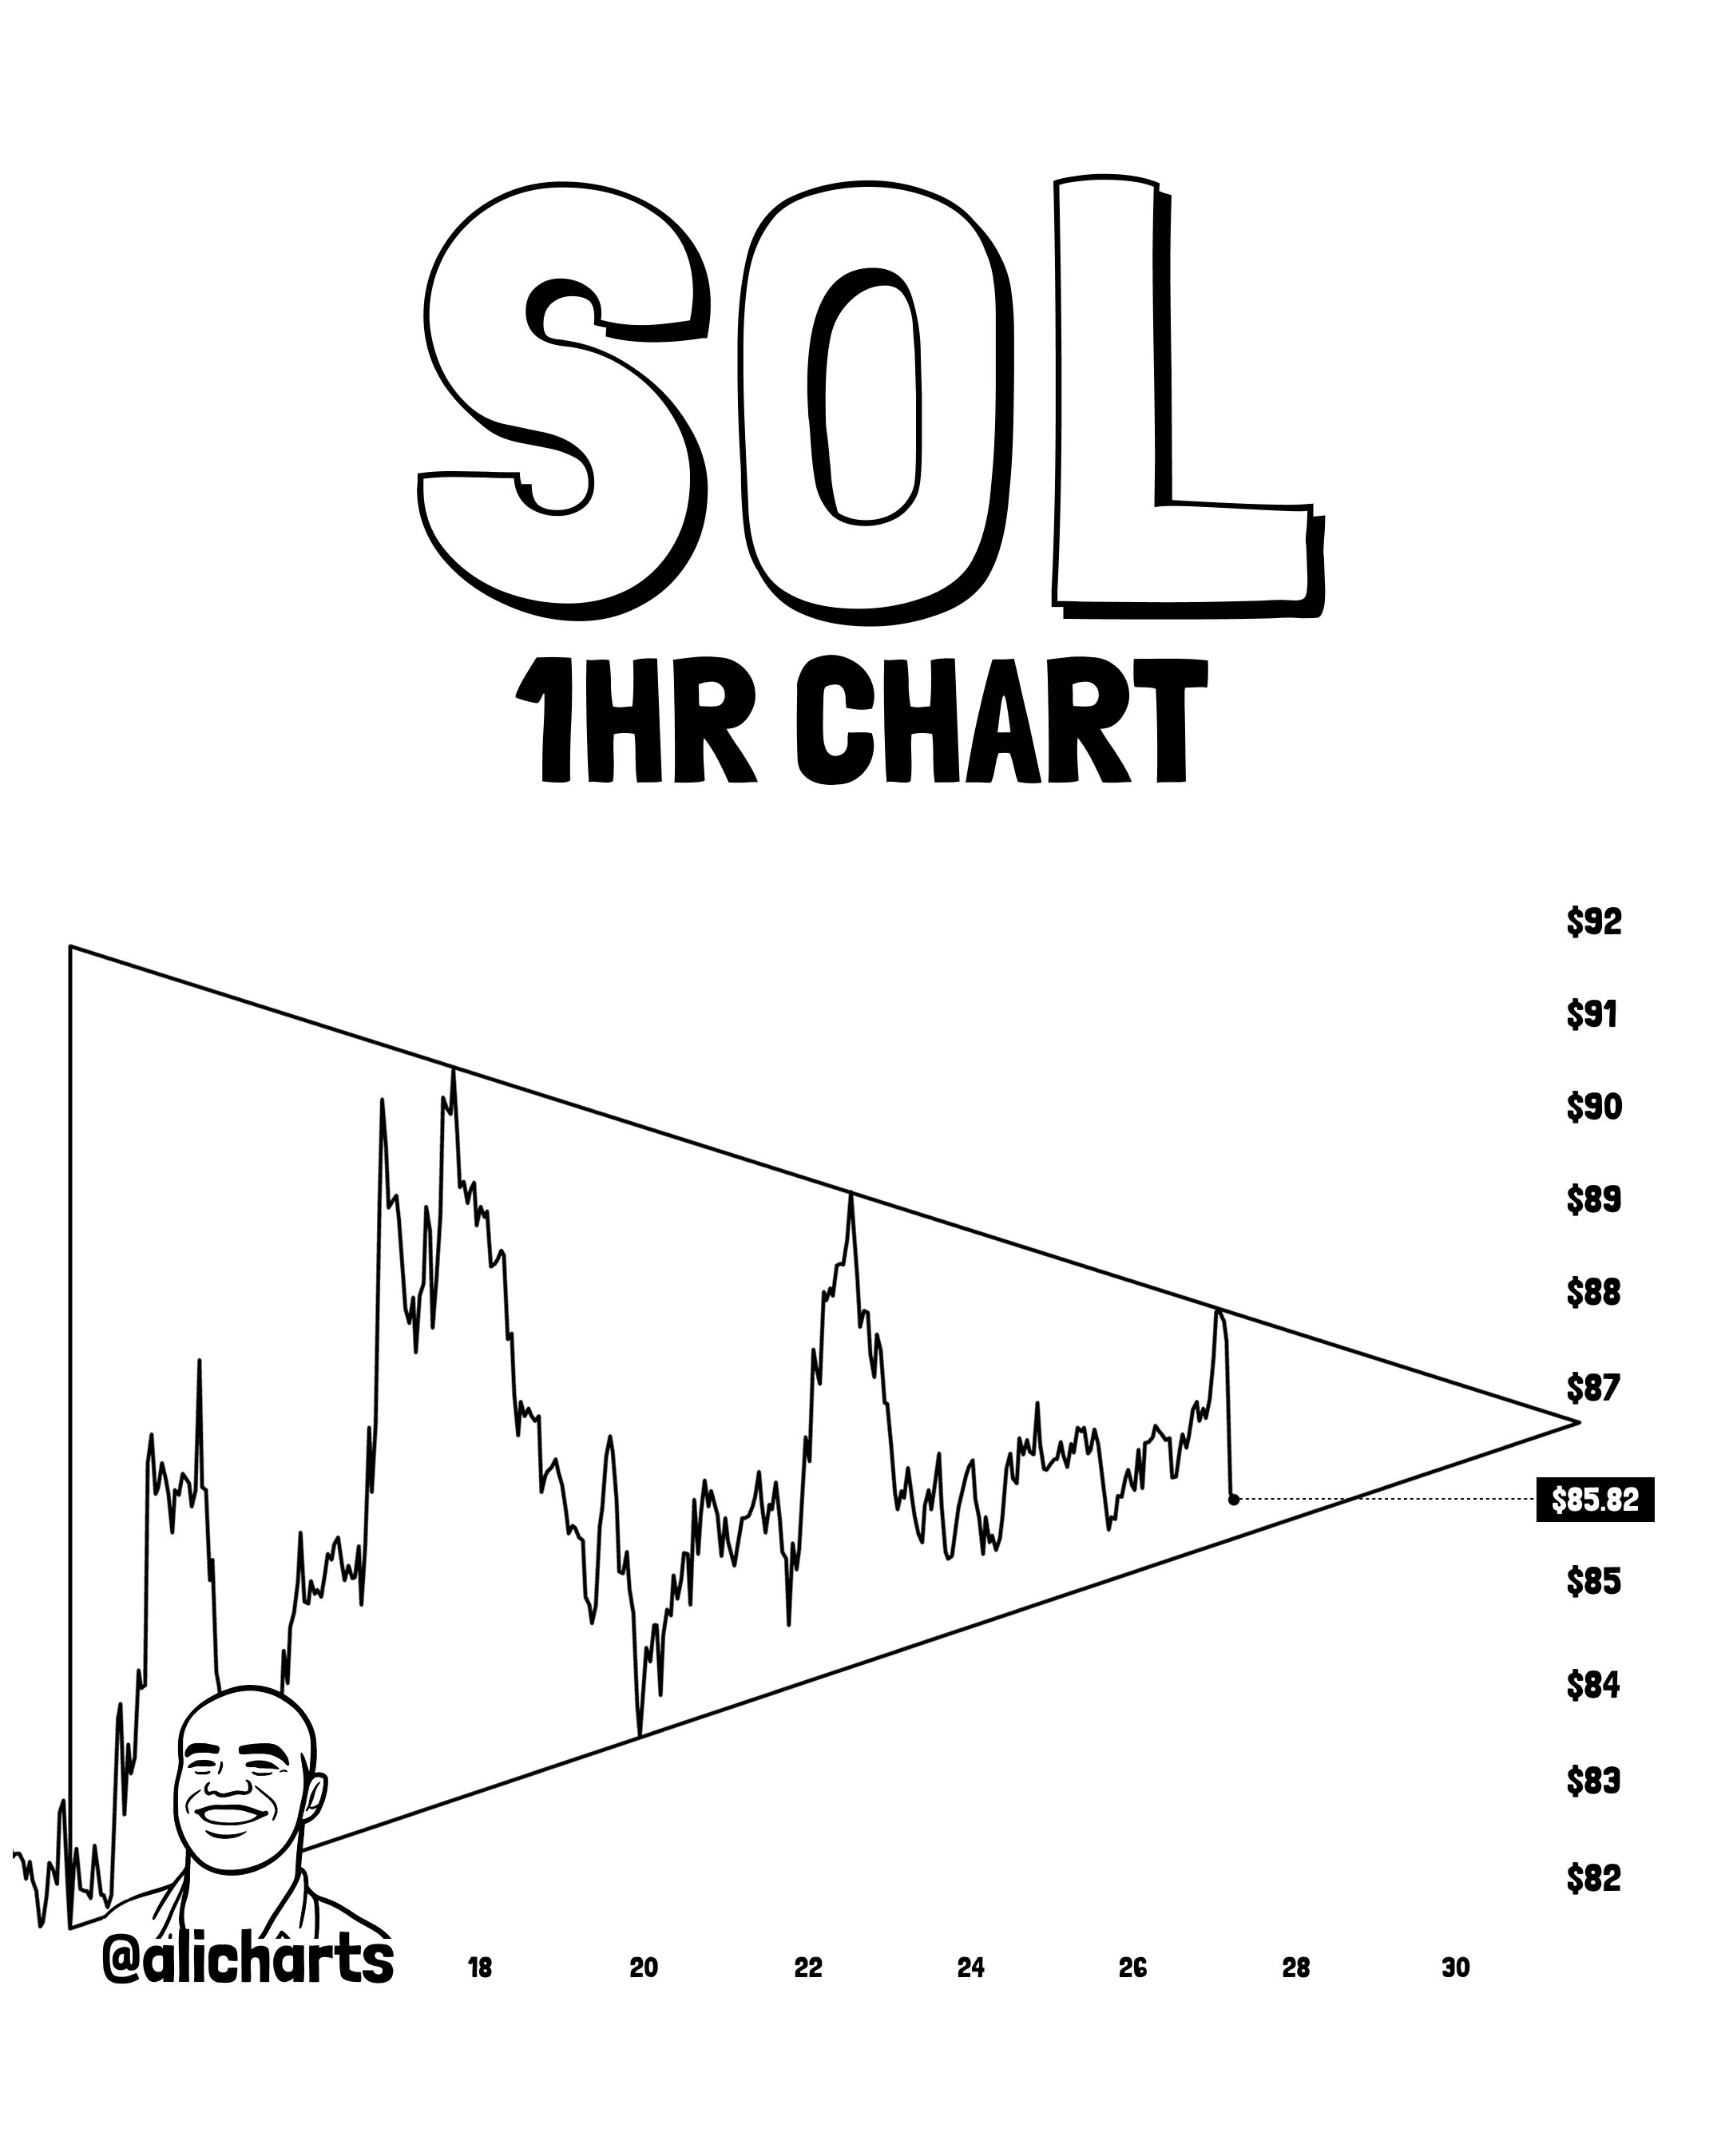
Analyst flags a 10% move setup in Solana as its 1‑hour chart coils into a symmetrical triangle. SOL trades near $84 after a fresh drop.
Ali Martinez shared the pattern on X. The post shows SOL nearing the triangle’s apex. See the chart and note.
Symmetrical triangles compress price. Two sloping lines. One resistance. One support. Breakouts often hit near the apex. Source.
The measured move is ~10%. Taken from the triangle’s height. Source.
Direction is neutral here. Break can go either way. That’s typical for symmetrical triangles. Pattern explainer.
Since the post, SOL pulled back more. That puts support at higher risk. Price sits around $84.
Key points for investors:
- Symmetrical triangle on 1‑hour SOL. Source
- Apex near, breakout window open. Source
- Estimated move ~10% on break. Source
- Pattern bias is neutral. Explainer
- SOL trades around $84 today. Context