7 0
Ethereum tests $2,250 support after breaking $2,300 and 100-hour average
Ethereum falls below $2,300, holds $2,250. Recovery capped by $2,300–$2,370.
Ethereum dropped under $2,300 and is consolidating above $2,250. Price action mirrors Bitcoin’s pullback reported by NewsBTC: Bitcoin dips under $76,500.
ETH trades below the 100-hour SMA. NewsBTC flagged the trend earlier in ETH drops below $2,350 — 100-hour SMA.
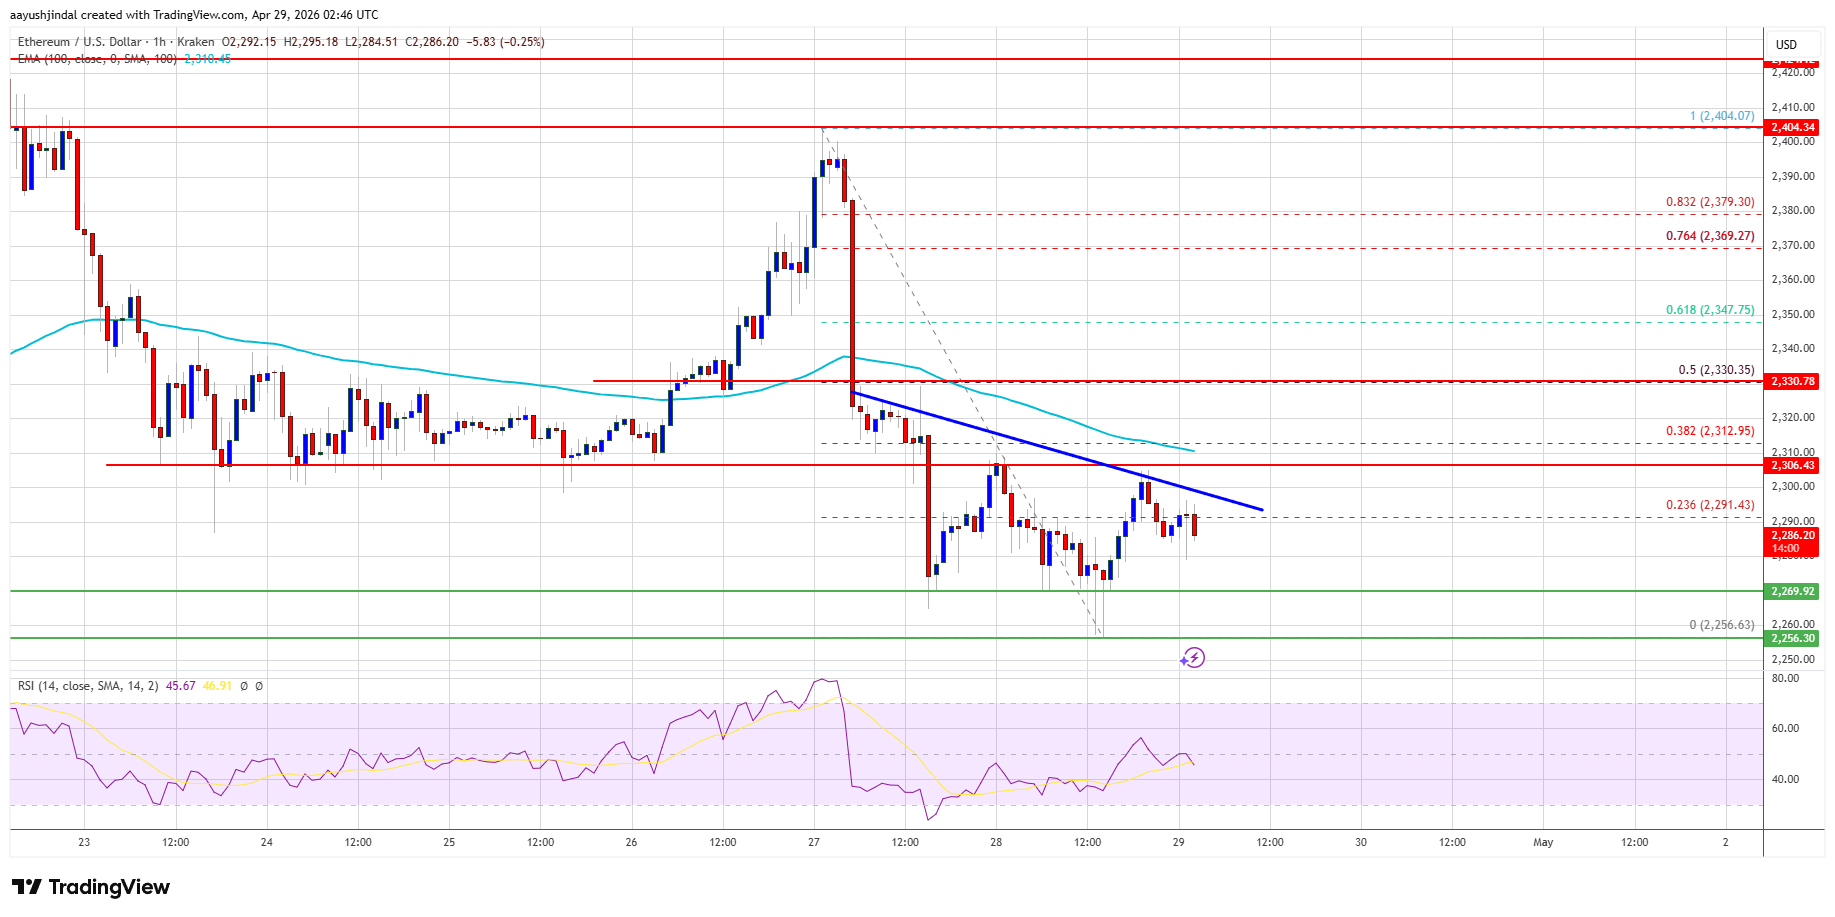
Bears hit a low at $2,256. Price bounced modestly, retracing ~23.6% of the $2,404 → $2,256 drop.
A bearish trend line caps $2,300 on the hourly chart. Bulls need a clean break to test higher.
- Immediate resistance: $2,300. Key barrier: $2,330 (50% Fib of $2,404 → $2,256).
- Next resistance: $2,370. Break above $2,400 opens $2,500–$2,550.
- Initial support: $2,250. Major supports: $2,220, then $2,180.
- Deeper supports: $2,155 and $2,120.
- Indicators: MACD bearish; RSI below 50.
Short term, ETH may attempt another leg up if $2,250 holds. Failure at $2,300 risks a fresh slide toward $2,220. Further context in NewsBTC’s coverage: ETH below $2,350 — SMA signal and Bitcoin pullback.