

Binance loses $6.36B to hack, BNB falls, funding turns negative
BNB fell 8.7% in an hour on Thursday, October 29, from $744.90 to $680, after hackers drained about $6.36 billion from Binance. BNB’s rebound has lagged major coins: it trades at $702, down 6.2% in 24 hours, with a $92.4 billion market cap and 48.7% below its October 2025 all-time high of $1,370. In futures, shorts are paying to keep positions open.
Why BNB Is Falling More Than Bitcoin
BNB is directly tied to Binance, and traders are pricing exchange risk. From 20:00 UTC Thursday, BNB is still down 5.6%, a larger decline than Bitcoin, Ether, Solana, XRP, or Dogecoin.
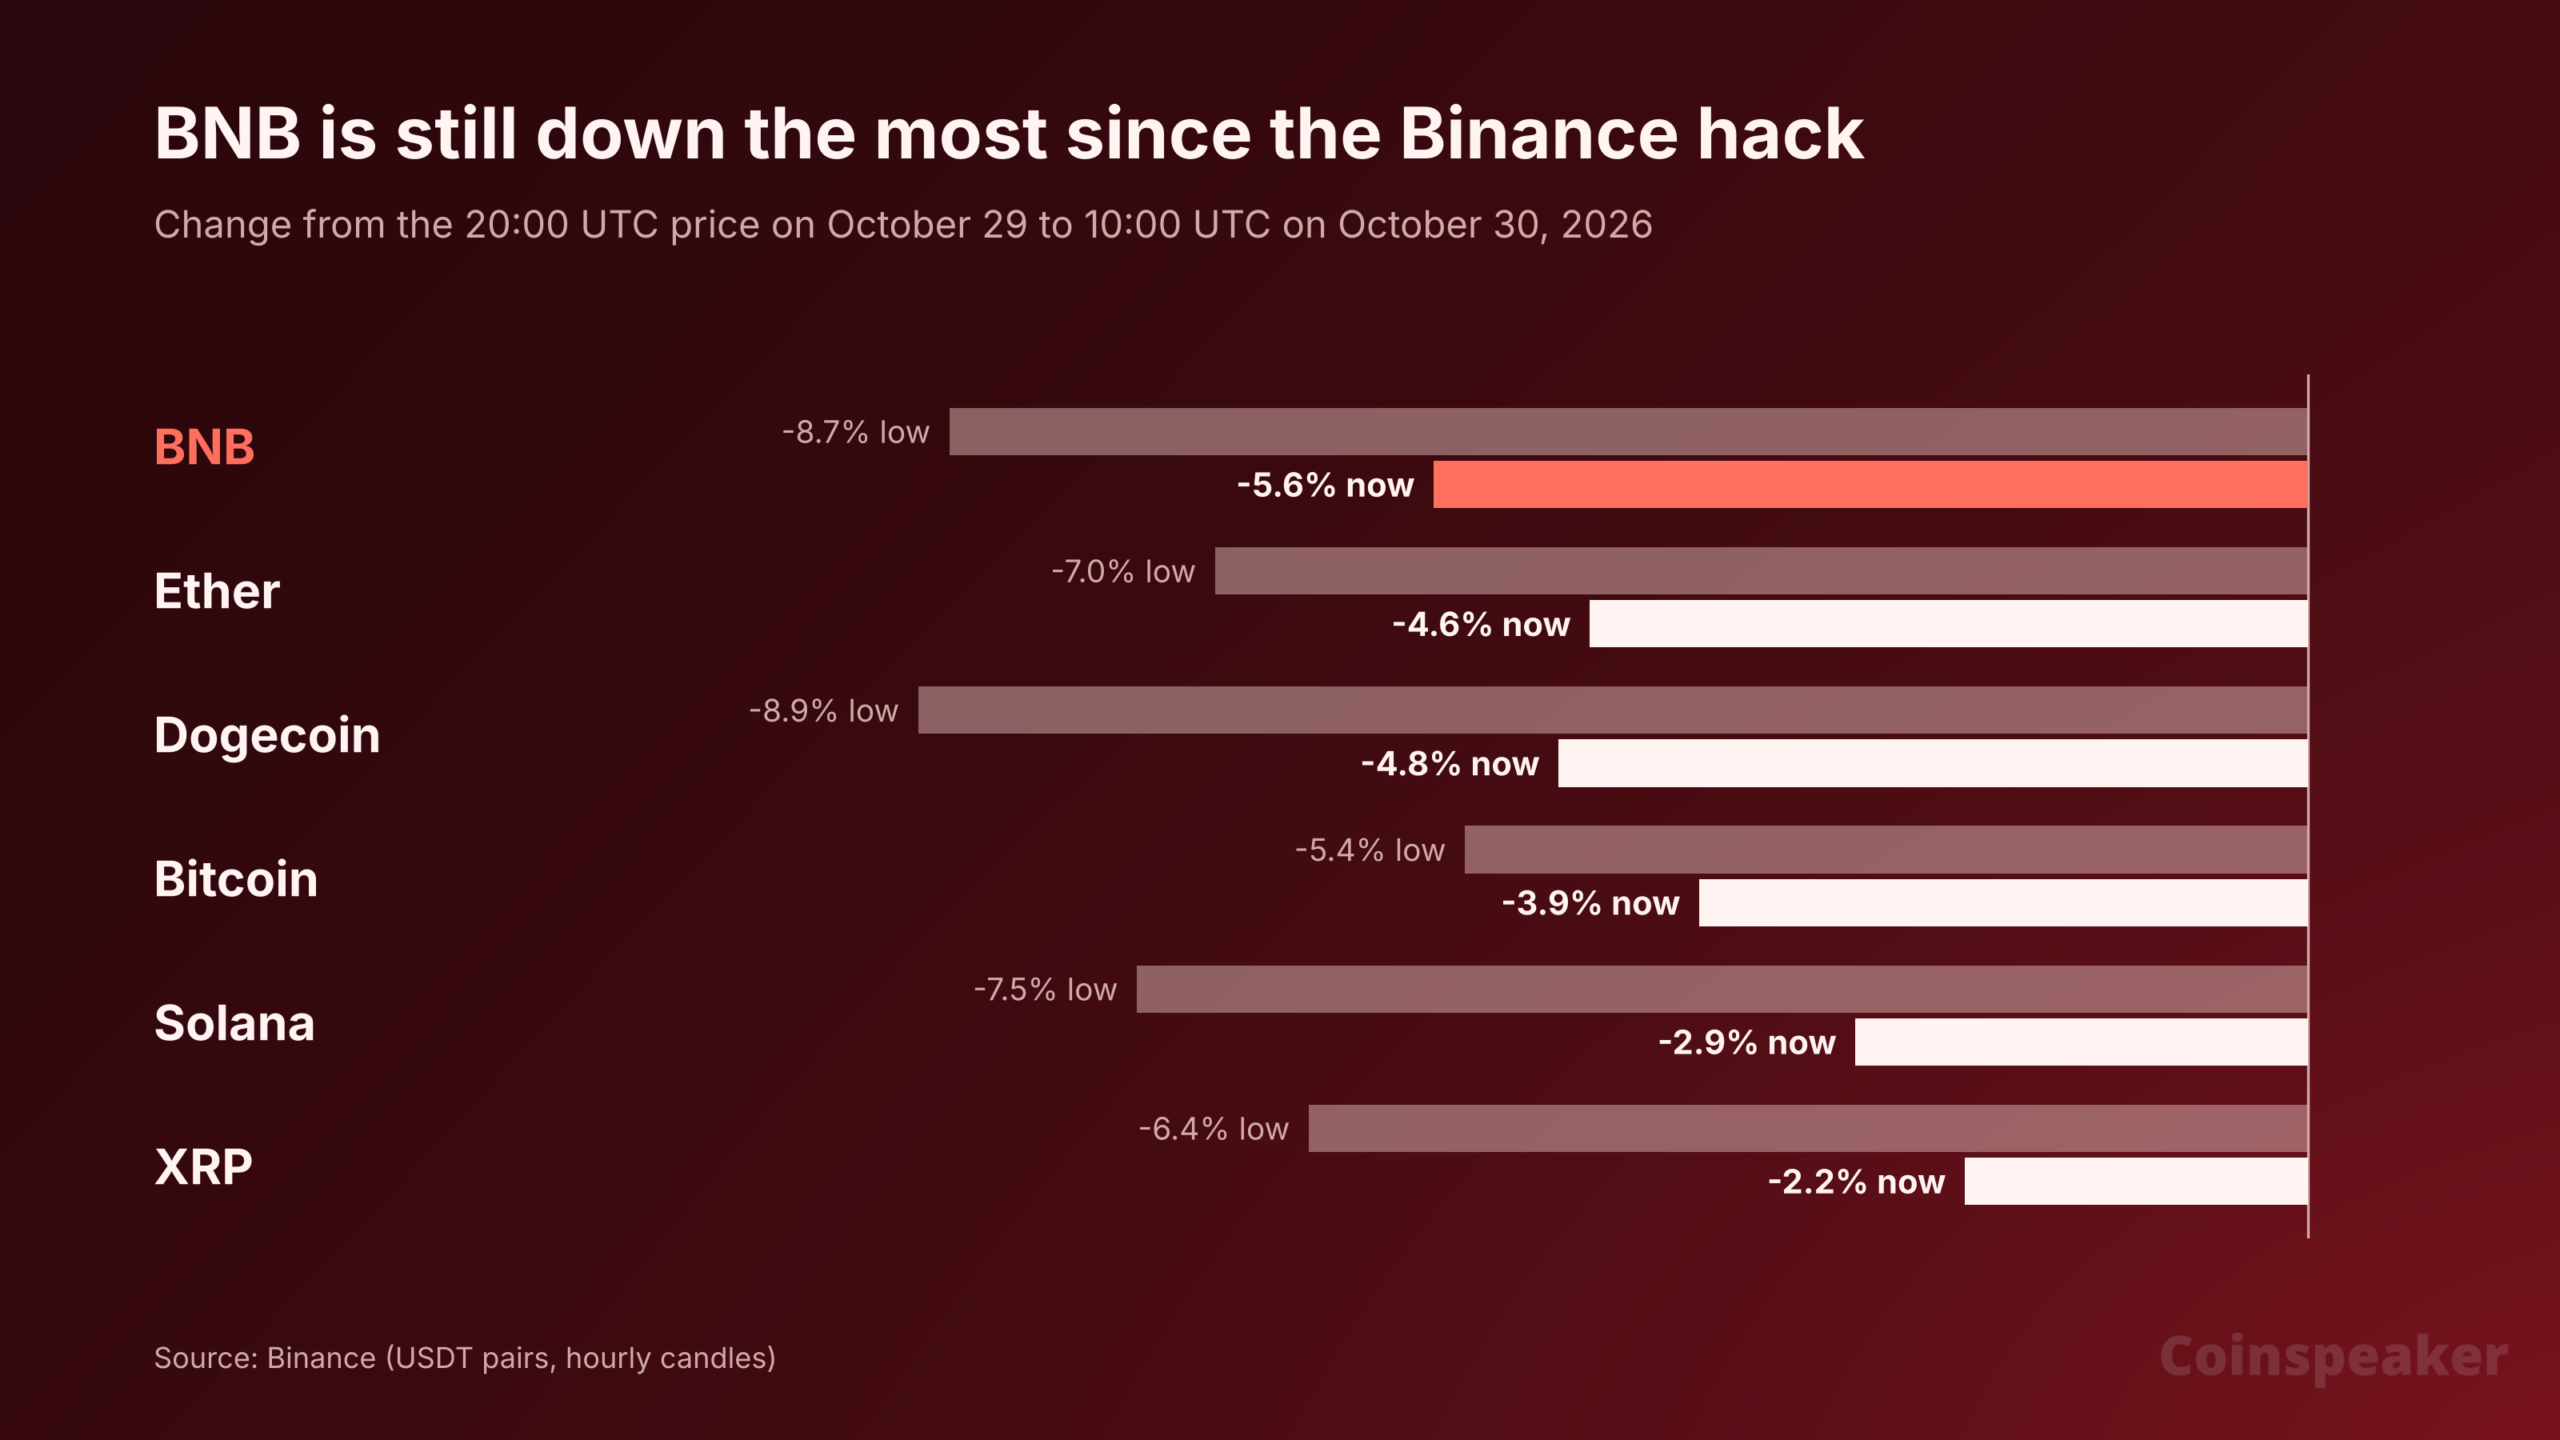
Large-cap coins since the Binance hack. Source: Binance
The hack did not directly impact BNB Chain. TRM Labs lists ten chains where Binance wallets were drained, including Ethereum and Polygon. BNB Chain is not among them. The market is assigning risk to Binance as the issuer of BNB.
Zeus Research analyst Dominick John: “The Binance exploit has intensified market-wide selling, with BNB facing the greatest exposure.” Rick Maeda of Laevitas: the drop is modest relative to the scale of the theft.
OKX futures data:
- Funding turned negative: the BNB perpetual flipped from +0.01% pre-hack to −0.0266% at midnight and −0.0434% at 08:00 UTC. Bitcoin funding stayed positive.
- Open interest rose 20%: from $54.8 million to $66 million.
- Most accounts are long: 2.79 longs per short, up from 2.66.
Positioning indicates many small accounts are buying the dip while fewer, larger traders are short. A bounce could force a short squeeze. A break lower could pressure crowded longs.
BNB After Past Binance Security Incidents
- May 7, 2019: 7,000 BTC stolen from a hot wallet. BNB fell 17.5% to $18.30 within three days, then rose 39.2% after a month.
- October 6, 2022: 2 million BNB minted via a BNB Chain bridge bug, about $570 million. BNB bottomed at $256.80 a week later, 12.7% below pre-hack levels, and gained 20.5% after 30 days.
Current drawdown relative to pre-hack price: 8.7% at worst so far. Historical patterns suggest potential for another leg down before recovery.
FTT comparisons center on exchange risk. Key difference: FTX had a balance-sheet shortfall. Binance states it will cover all losses. Tether, Circle, and others froze about $2.7 billion of stolen funds within hours. Uncertainty remains: Binance has not disclosed how it will fund payouts, and withdrawals remain paused pending a reopening targeted within 48 hours of its Friday morning update.
BNB Price: 200-Day EMA Test
BNB closed Thursday at $698.46, slightly above the 200-day EMA at $692.46. The intraday low at $680 dipped below it. The 50-day EMA at $733.06 is now resistance.
Four-month context: BNB is back to late August levels. It ranged between $674.60 and $726 for two weeks, broke out in early September, and reached $809.99 on October 5. Thursday’s drop retraced that advance.
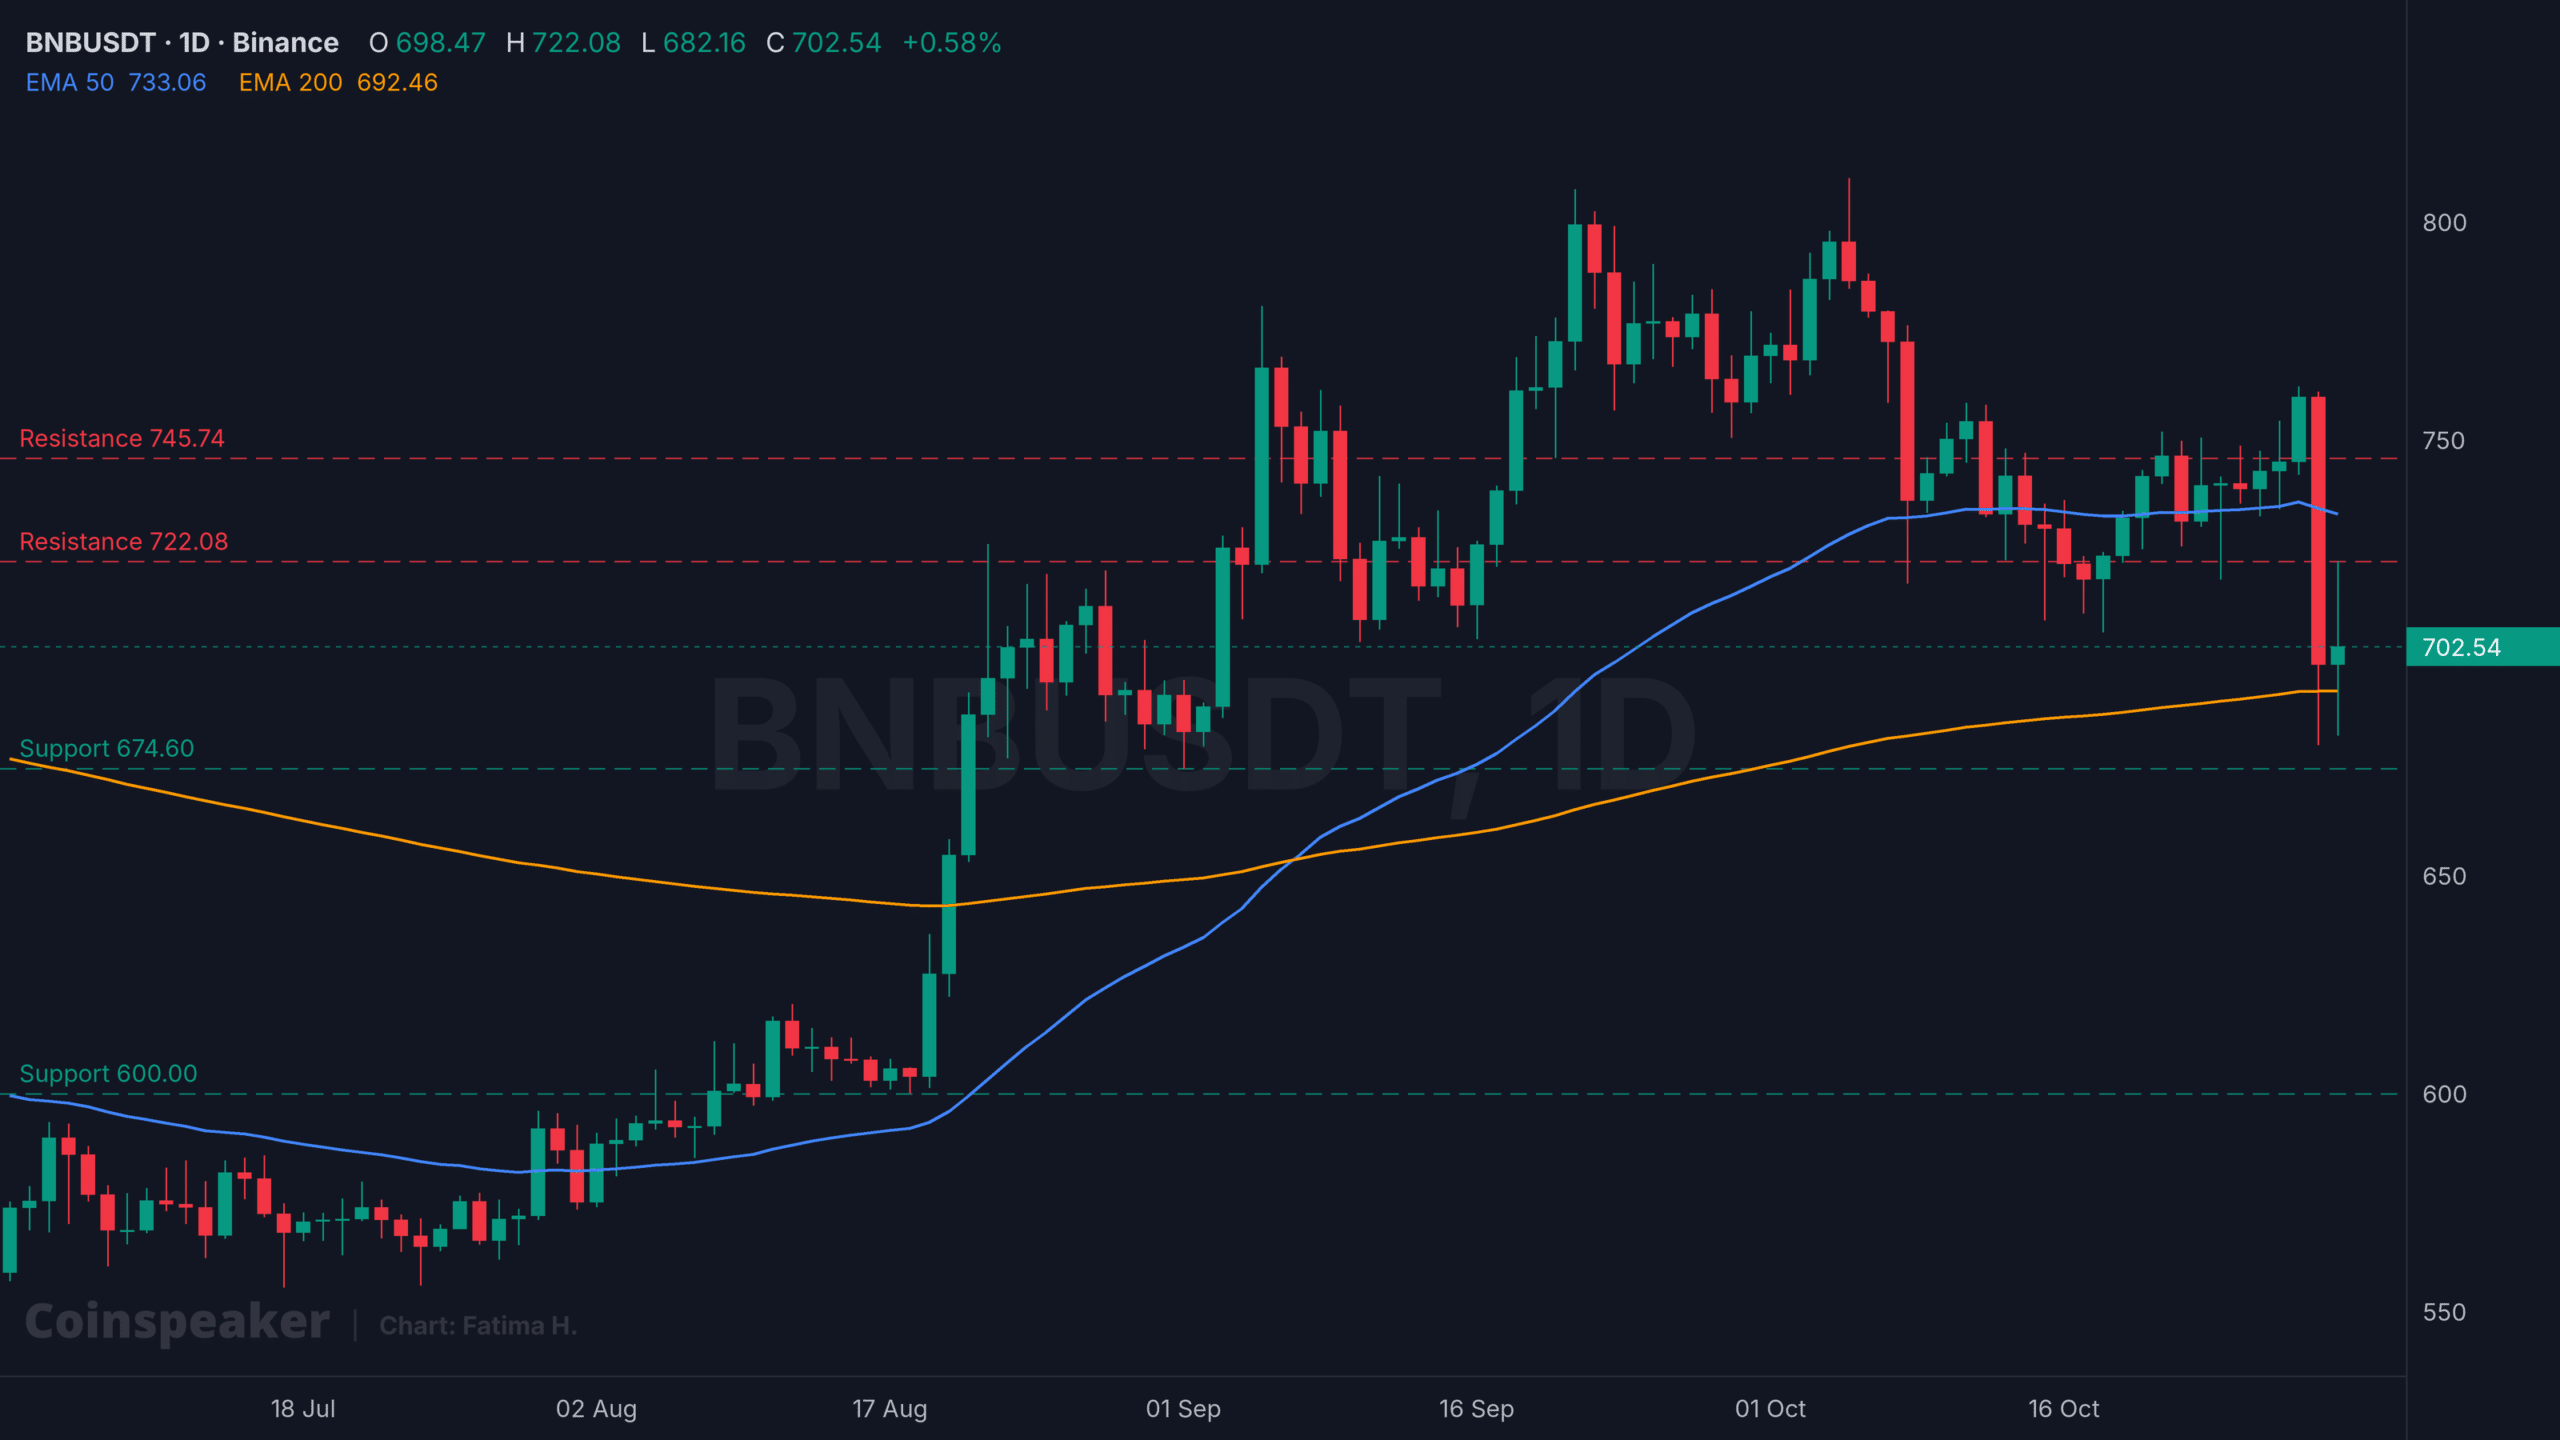
BNBUSDT 1D chart. Source: TradingView
Key Levels and Triggers
- Rebound: daily close above $733.06, the 50-day EMA; next level $745.74, the pre-hack price.
- Holding pattern: range between $674.60 and $722.08, with price clustering around the 200-day EMA until withdrawals reopen.
- Sell-off: daily close below $674.60; next support near $600, the mid-August base.
The next 48 hours outweigh chart signals. A smooth reopening of Binance withdrawals could squeeze shorts. A delay or evidence of BNB sales to cover losses would increase the probability of a test of $674.60.
Authors credited by the source: Daniel Francis
Published by Holder based on an external source.