
ETF data shows no shift from gold and silver to Bitcoin
Silver and gold extended losses while Bitcoin held near $63,800 after twice rebounding from $62,000 in four days. Data from major US ETFs shows no clear rotation from metals into Bitcoin: trading in metals spiked on down days, while Bitcoin volumes stayed near average. BTC’s rebound occurred on lighter volume, indicating cautious buying.
Fund Flows and Trading: No Evidence of Rotation
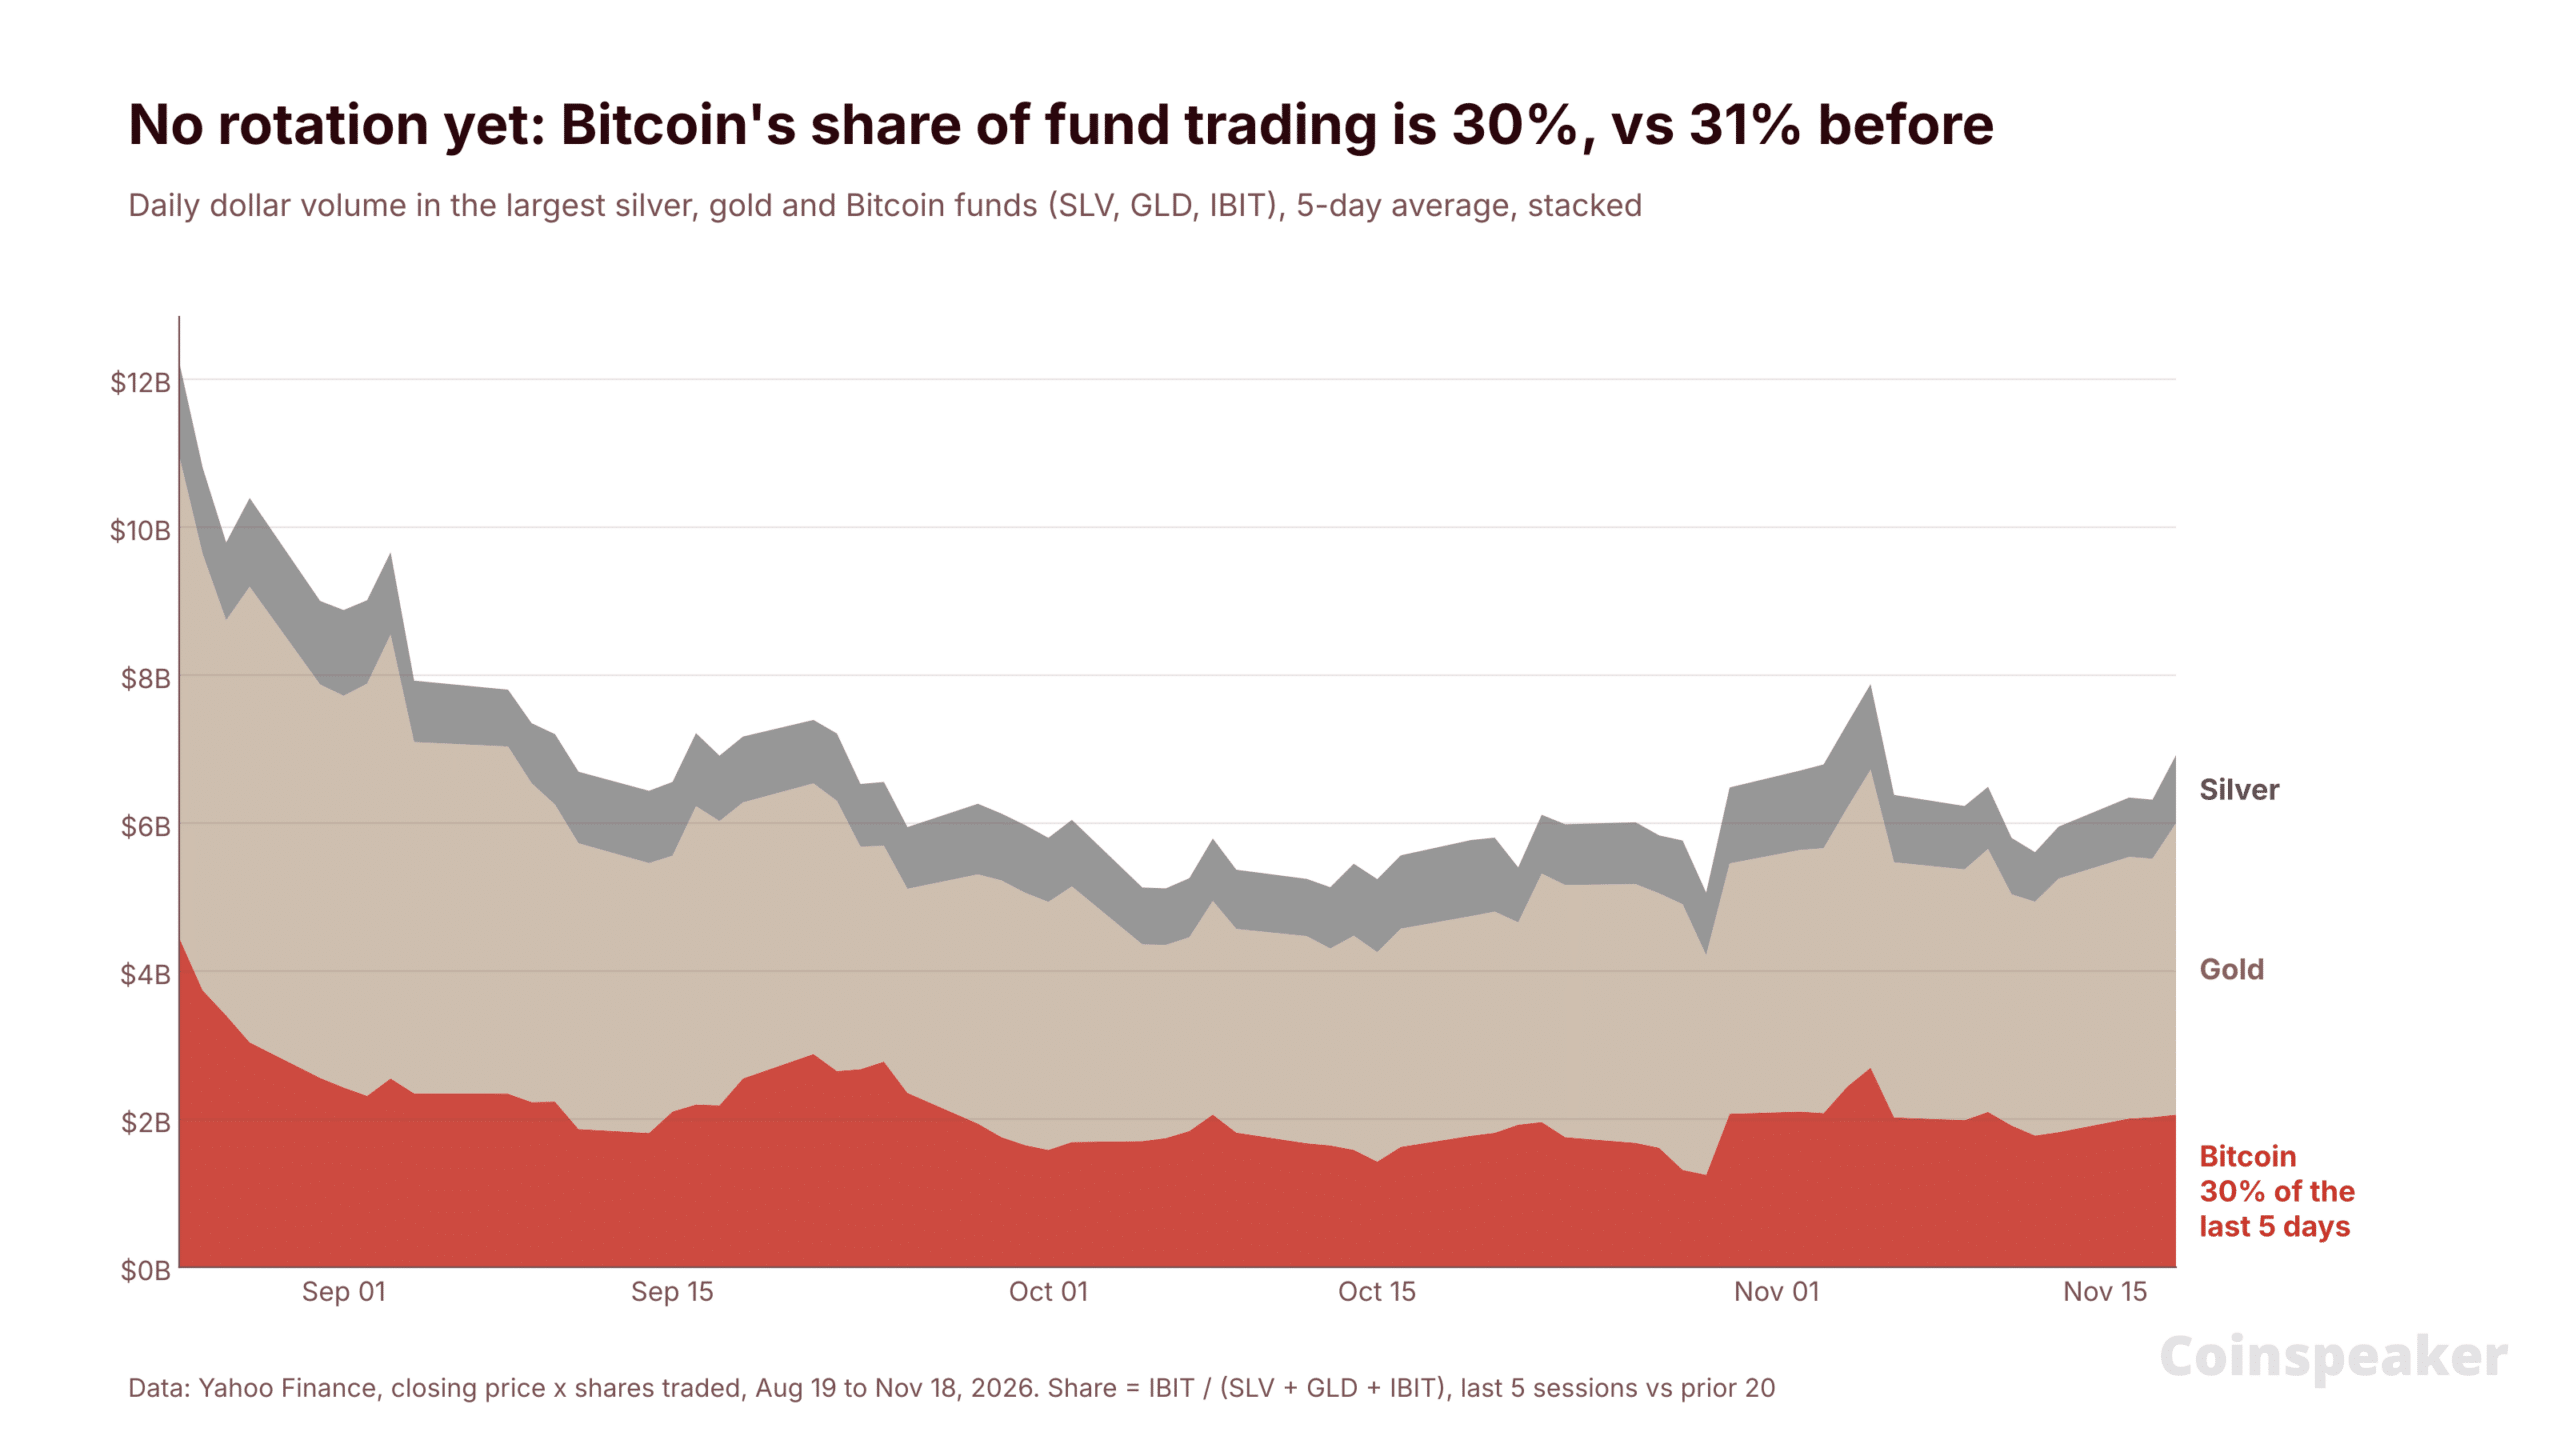
Method: compared daily dollars traded price times shares across three largest US funds: iShares Silver Trust (SLV), SPDR Gold Shares (GLD), and iShares Bitcoin Trust (IBIT).
- Bitcoin’s share flat: IBIT captured 30% of combined SLV, GLD, IBIT trading over the past five sessions versus 31% over the prior 20.
- Metals trading rose on sell-off: SLV: $1.17 billion traded, 33% above 20-day average. GLD: $4.38 billion, about one-third above average. Elevated volume on down days signals selling pressure.
- Bitcoin trading steady: IBIT: $1.98 billion, near its 20-day average of $1.90 billion.
Conclusion: outflows from metals are not showing up in Bitcoin funds yet. The move looks broad-based risk-off, with heavier pressure on metals.
Volume Signals: Bounce on Thin Liquidity
Binance BTCUSDT:
- Sell-off phase Nov 13–15: average $2.0 billion daily.
- Post-bounce past three sessions: average $1.5 billion daily.
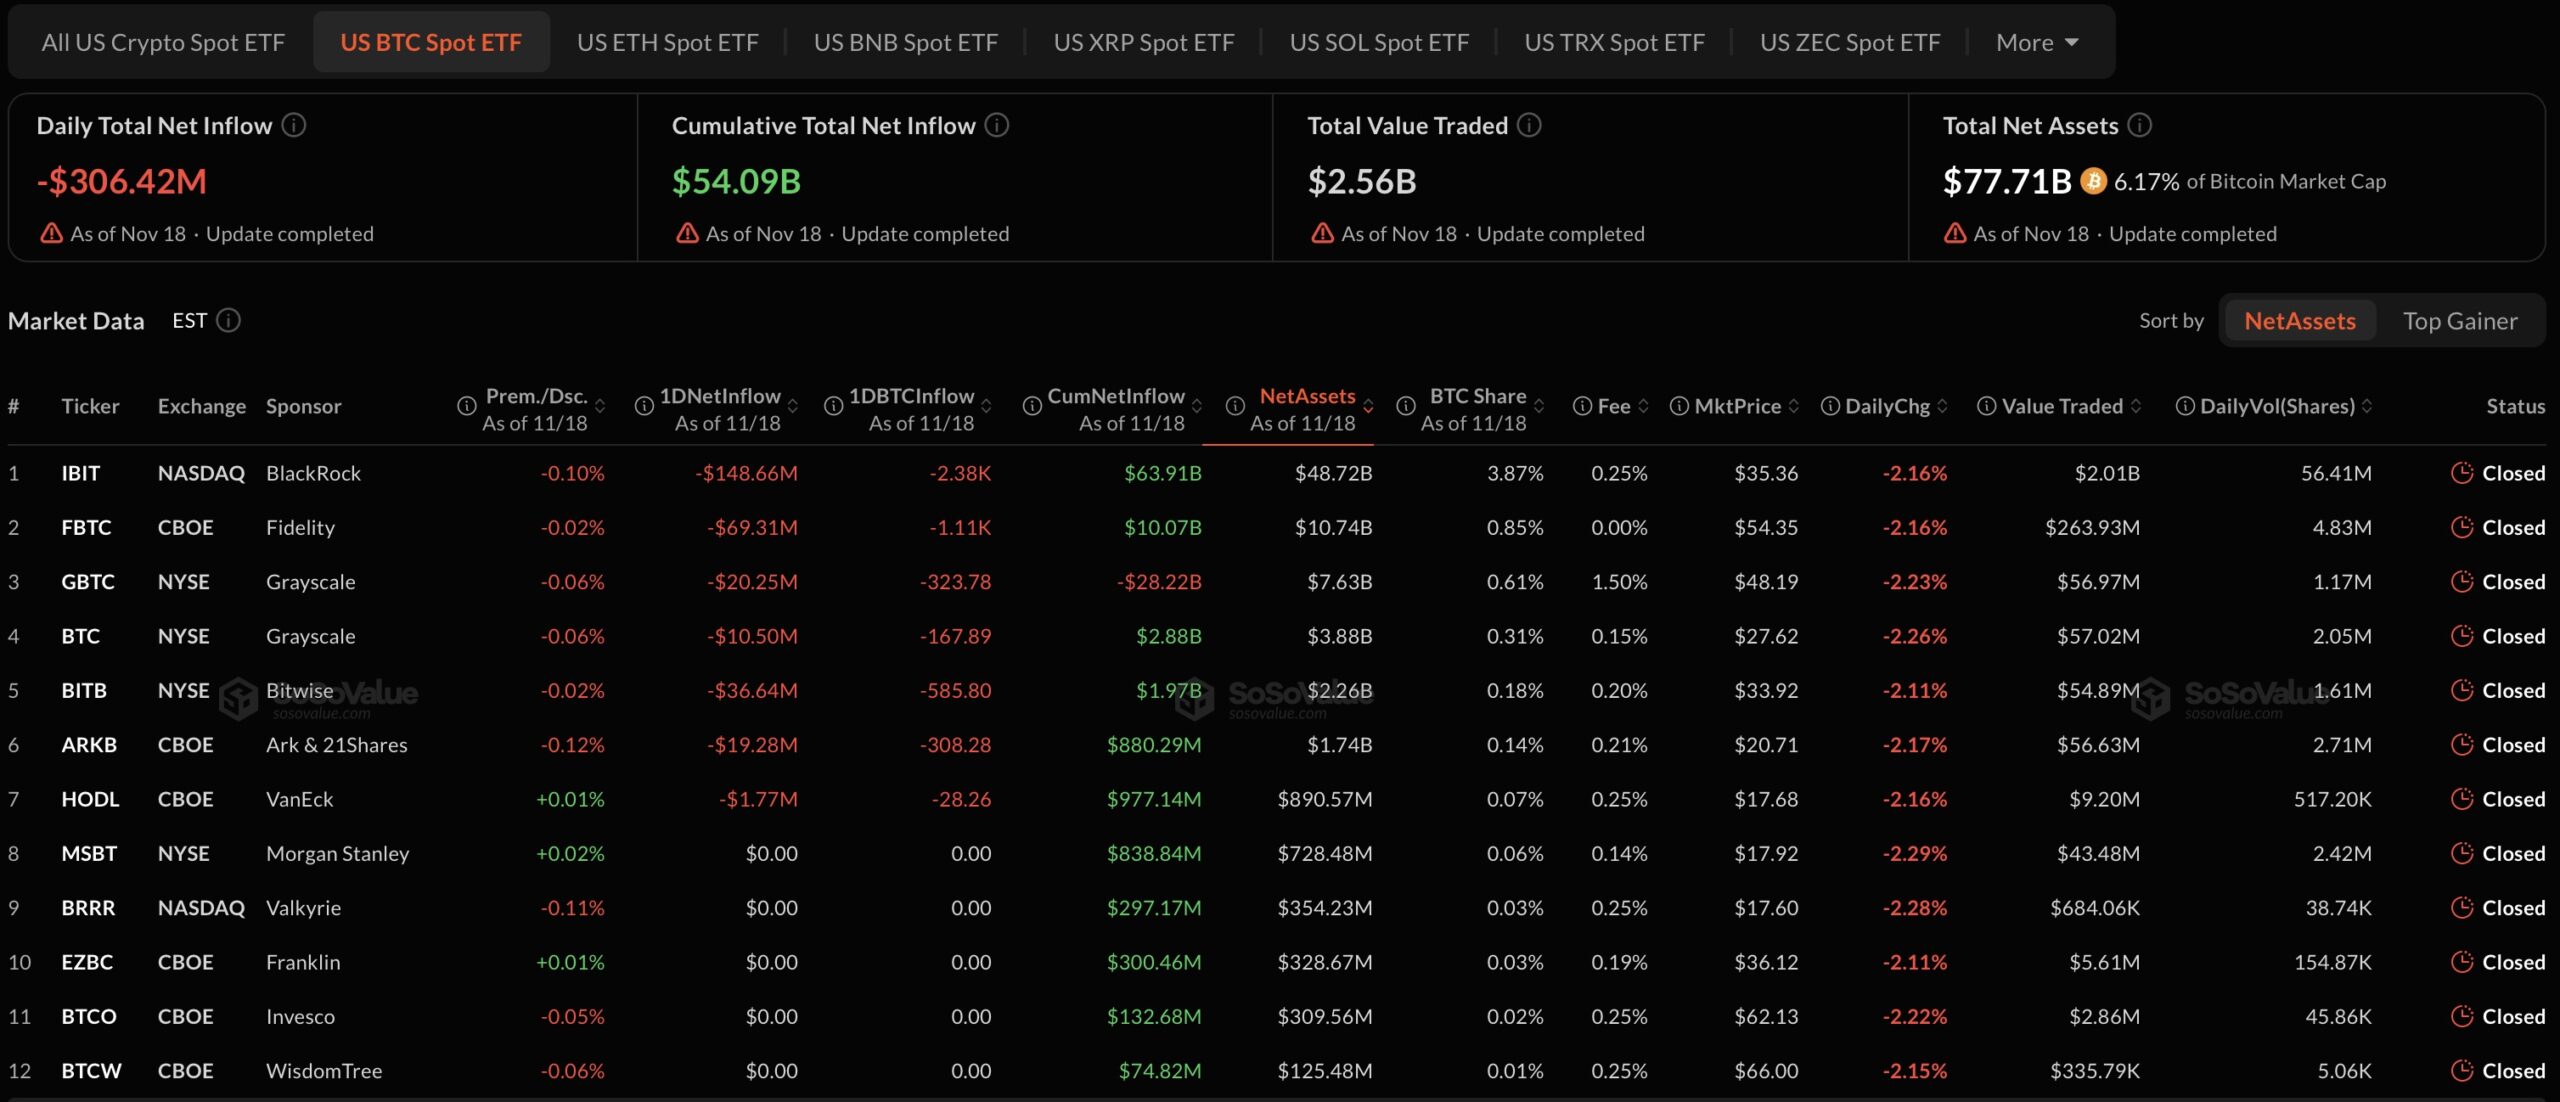
Interpretation: fewer buyers stepped in. Spot ETF flows are tentative: IBIT recorded a $76.5 million inflow on Nov 16 after 11 straight outflow days. Macro driver: expectations for another Federal Reserve rate hike in December weigh on non-yielding assets, including metals and Bitcoin.
US BTC Spot ETF Sosovalue
Price Levels: Support Held Twice, Resistance Overhead
BTC trades near $63,713, below 50-day EMA $75,245 and 200-day EMA $75,624.
- Support: $62,300. Held in February, June, July, August, and twice this week. Next support: $57,800, July low.
- Resistance: $65,500. Rejected multiple times in 2026. Above that: $74,300.
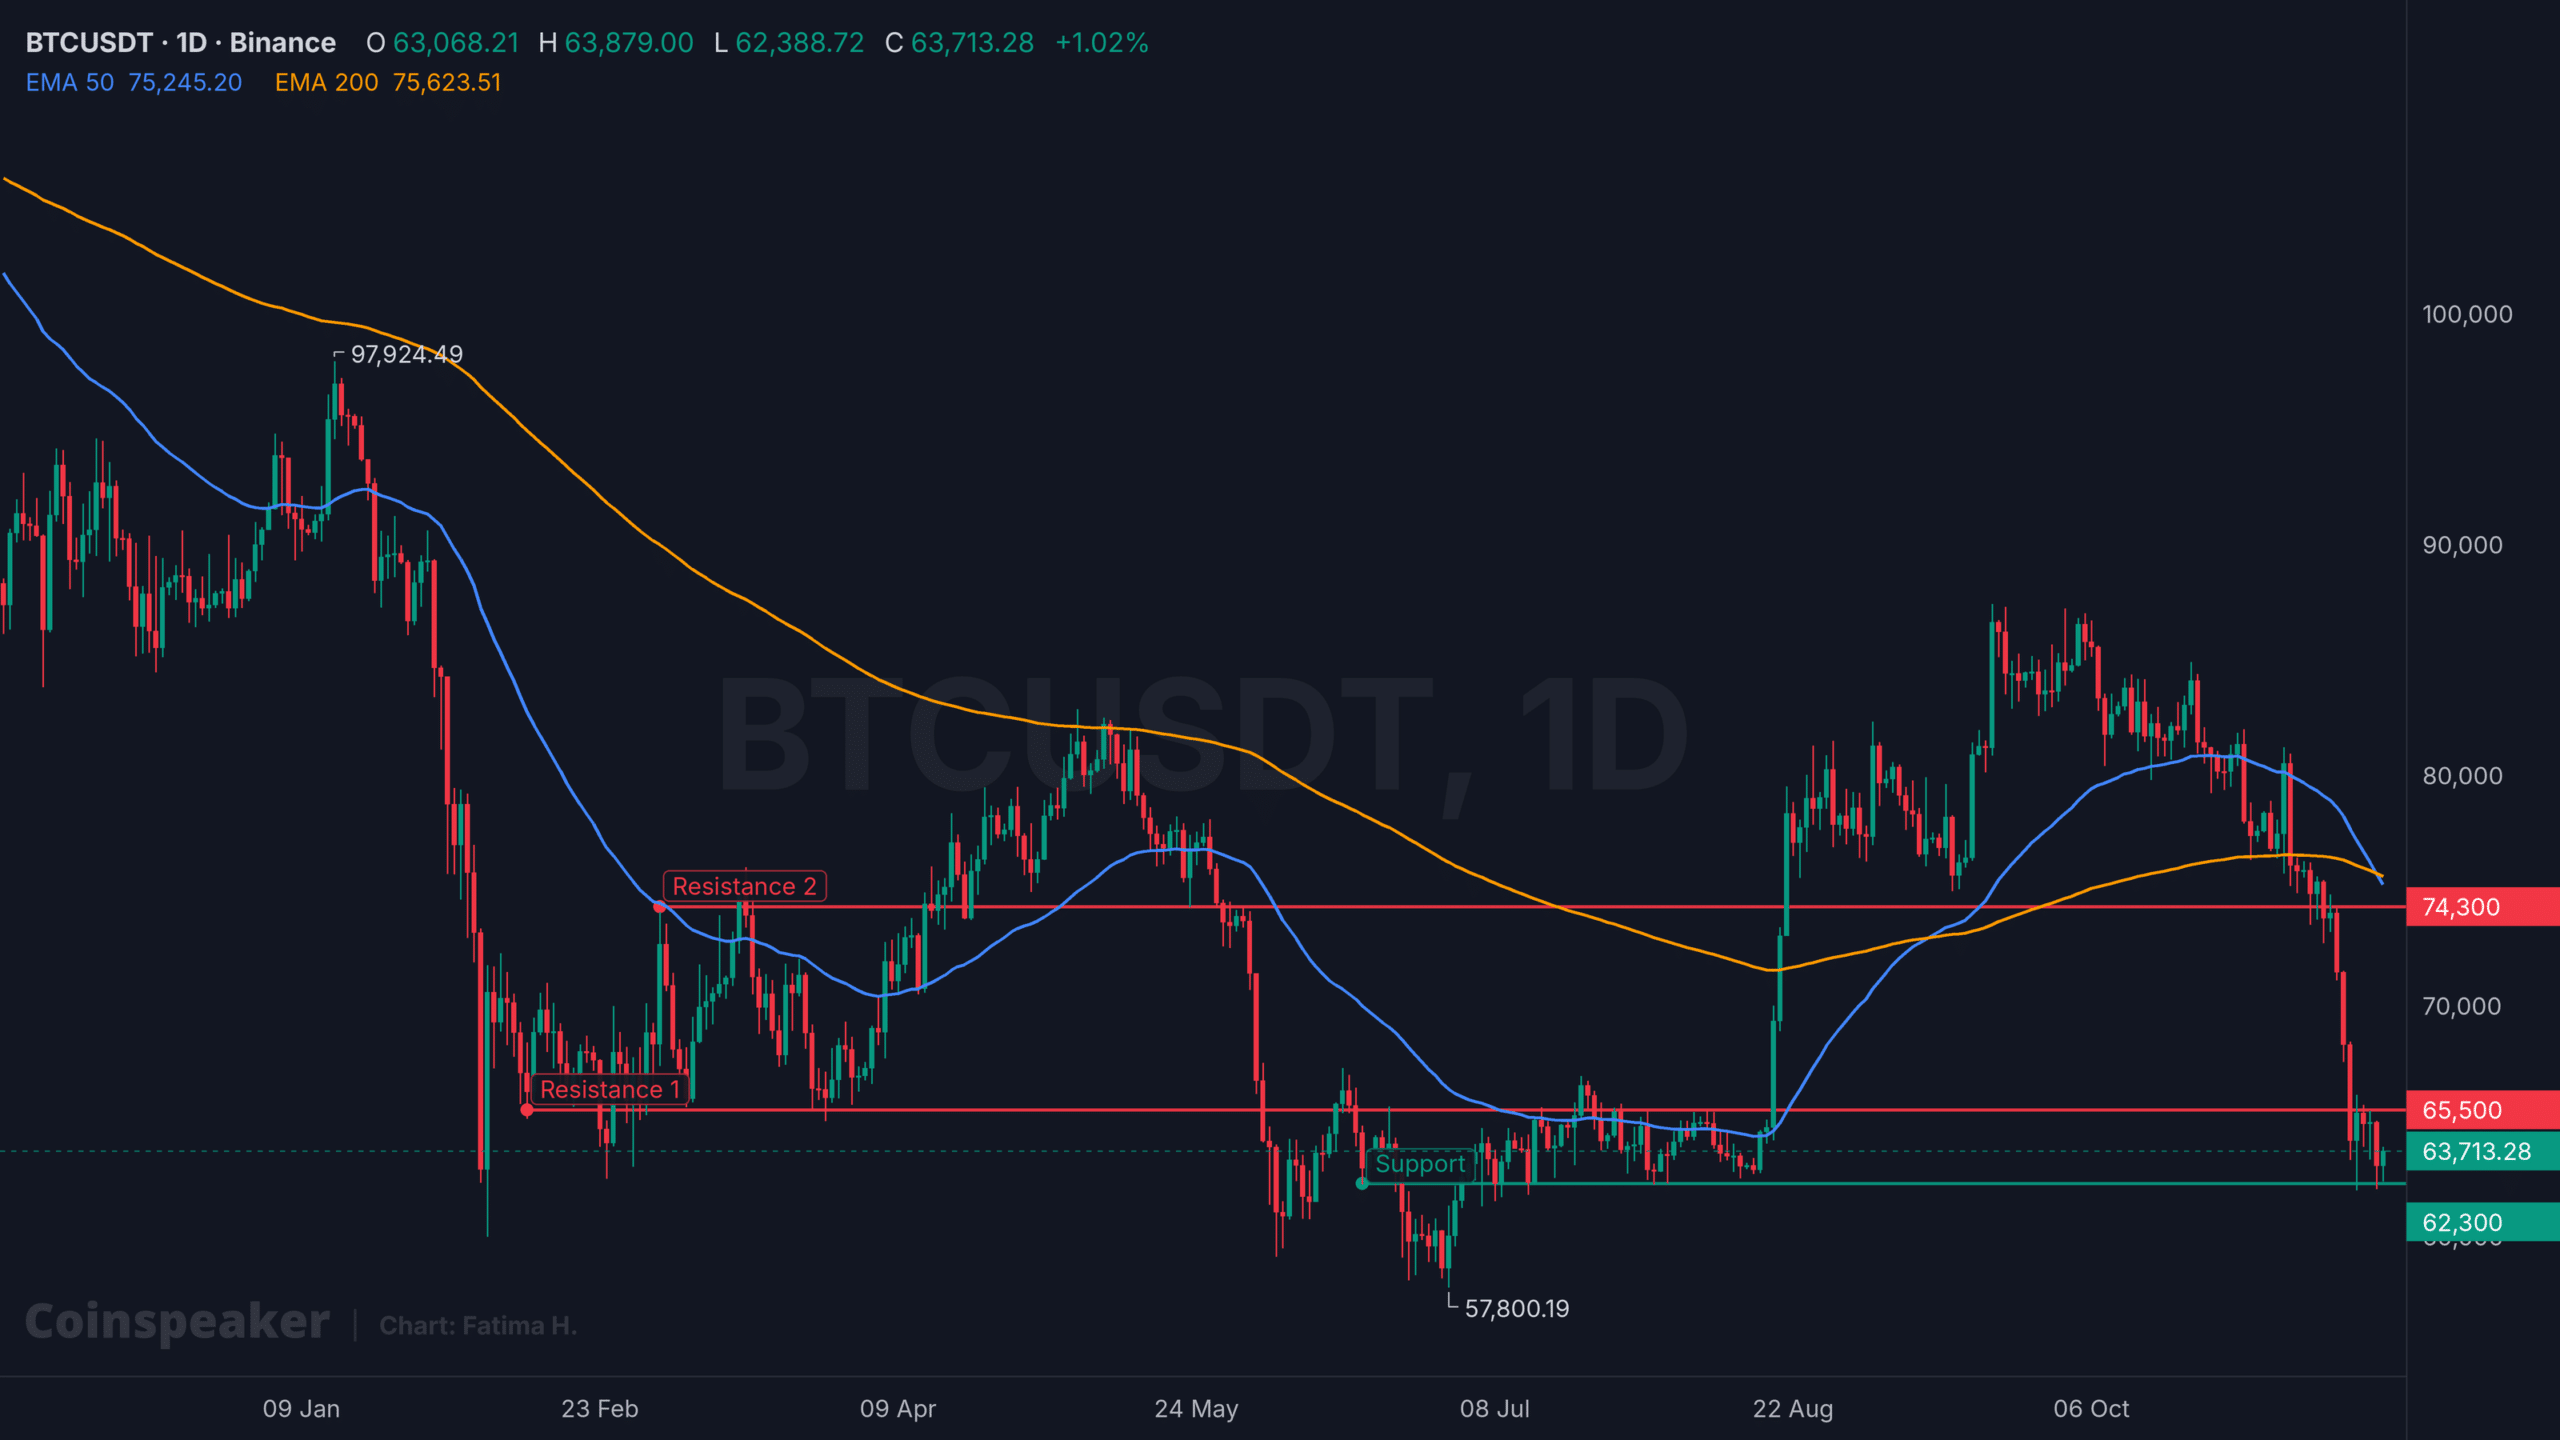
BTCUSDT 1D chart. Source: TradingView
Scenarios
| Outlook | Trigger | Level to watch |
|---|---|---|
| Rebound | Daily close above $65,500 on rising volume | $74,300 |
| Holding pattern | Range between $62,300 and $65,500 | Maintain range |
| Sell-off | Daily close below $62,300 | $57,800 |
Key confirmations: spot and futures volume near $2 billion daily on upside moves, and IBIT’s share of combined SLV, GLD, IBIT trading rising above one-third. Absent these, the bounce reflects reduced selling rather than new buying.
Authors credited by the source: Daniel Francis
Published by Holder based on an external source.