
Ethereum outflows from Binance hit 3-year high as ETFs add 102k ETH
Ethereum holders are withdrawing coins from Binance at the fastest pace in three years as ETH nears a multi-year resistance zone. The shift in supply from exchanges coincides with an 80% rally since July and growing evidence of long-term positioning, including fresh ETF inflows and staking activity, despite a minor daily pullback.
Exchange Outflows: Scope and Significance
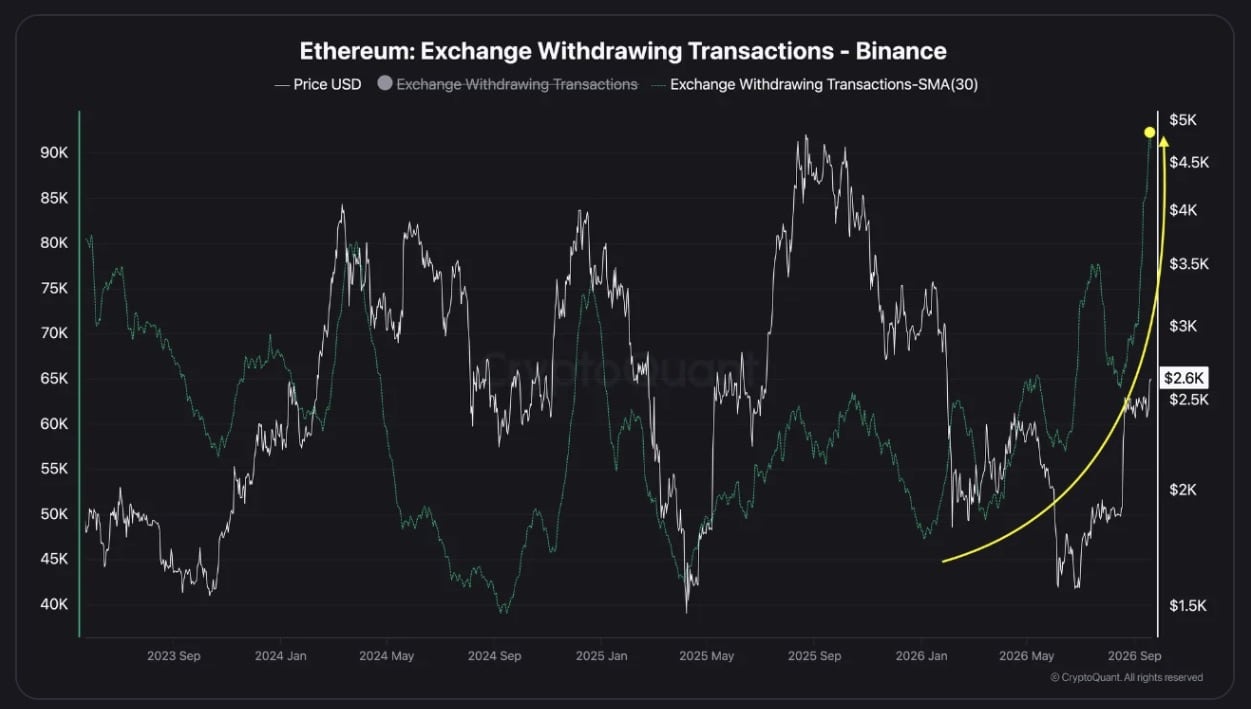
Ethereum: Exchange Withdrawing Transactions CryptoQuant
- CryptoQuant: the monthly average of ETH withdrawal transactions from Binance exceeded 90,000, the highest since 2023 and roughly double early-2026 levels. The increase is sharper for ETH than BTC.
- Implication: coins held on exchanges are available for immediate sale, while coins withdrawn to private wallets or custodians typically are not. Accelerating outflows reduce sell-side liquidity and can amplify upside moves if demand persists.
Institutional Flows and Large Holders
- US spot Ethereum ETFs on September 21 absorbed 102,130 ETH, about $280 million at prevailing prices. BlackRock’s ETHA took 41,650 ETH, Fidelity’s FETH 27,610, and Grayscale’s mini trust 22,430. Cumulative holdings since launch: about 3.78 million ETH.
- Weekly context: mid-week ETF inflows dipped, leaving August net inflows under $190 million, then recovered. The current accumulation trend is driven more by individual holders than by sustained institutional buying.
- Large-wallet activity: onchain data shows a whale swapped 1,308 BTC for 40,670 ETH over six days and staked the ETH, reinforcing the shift toward long-term positioning.
Price Context and Key Levels
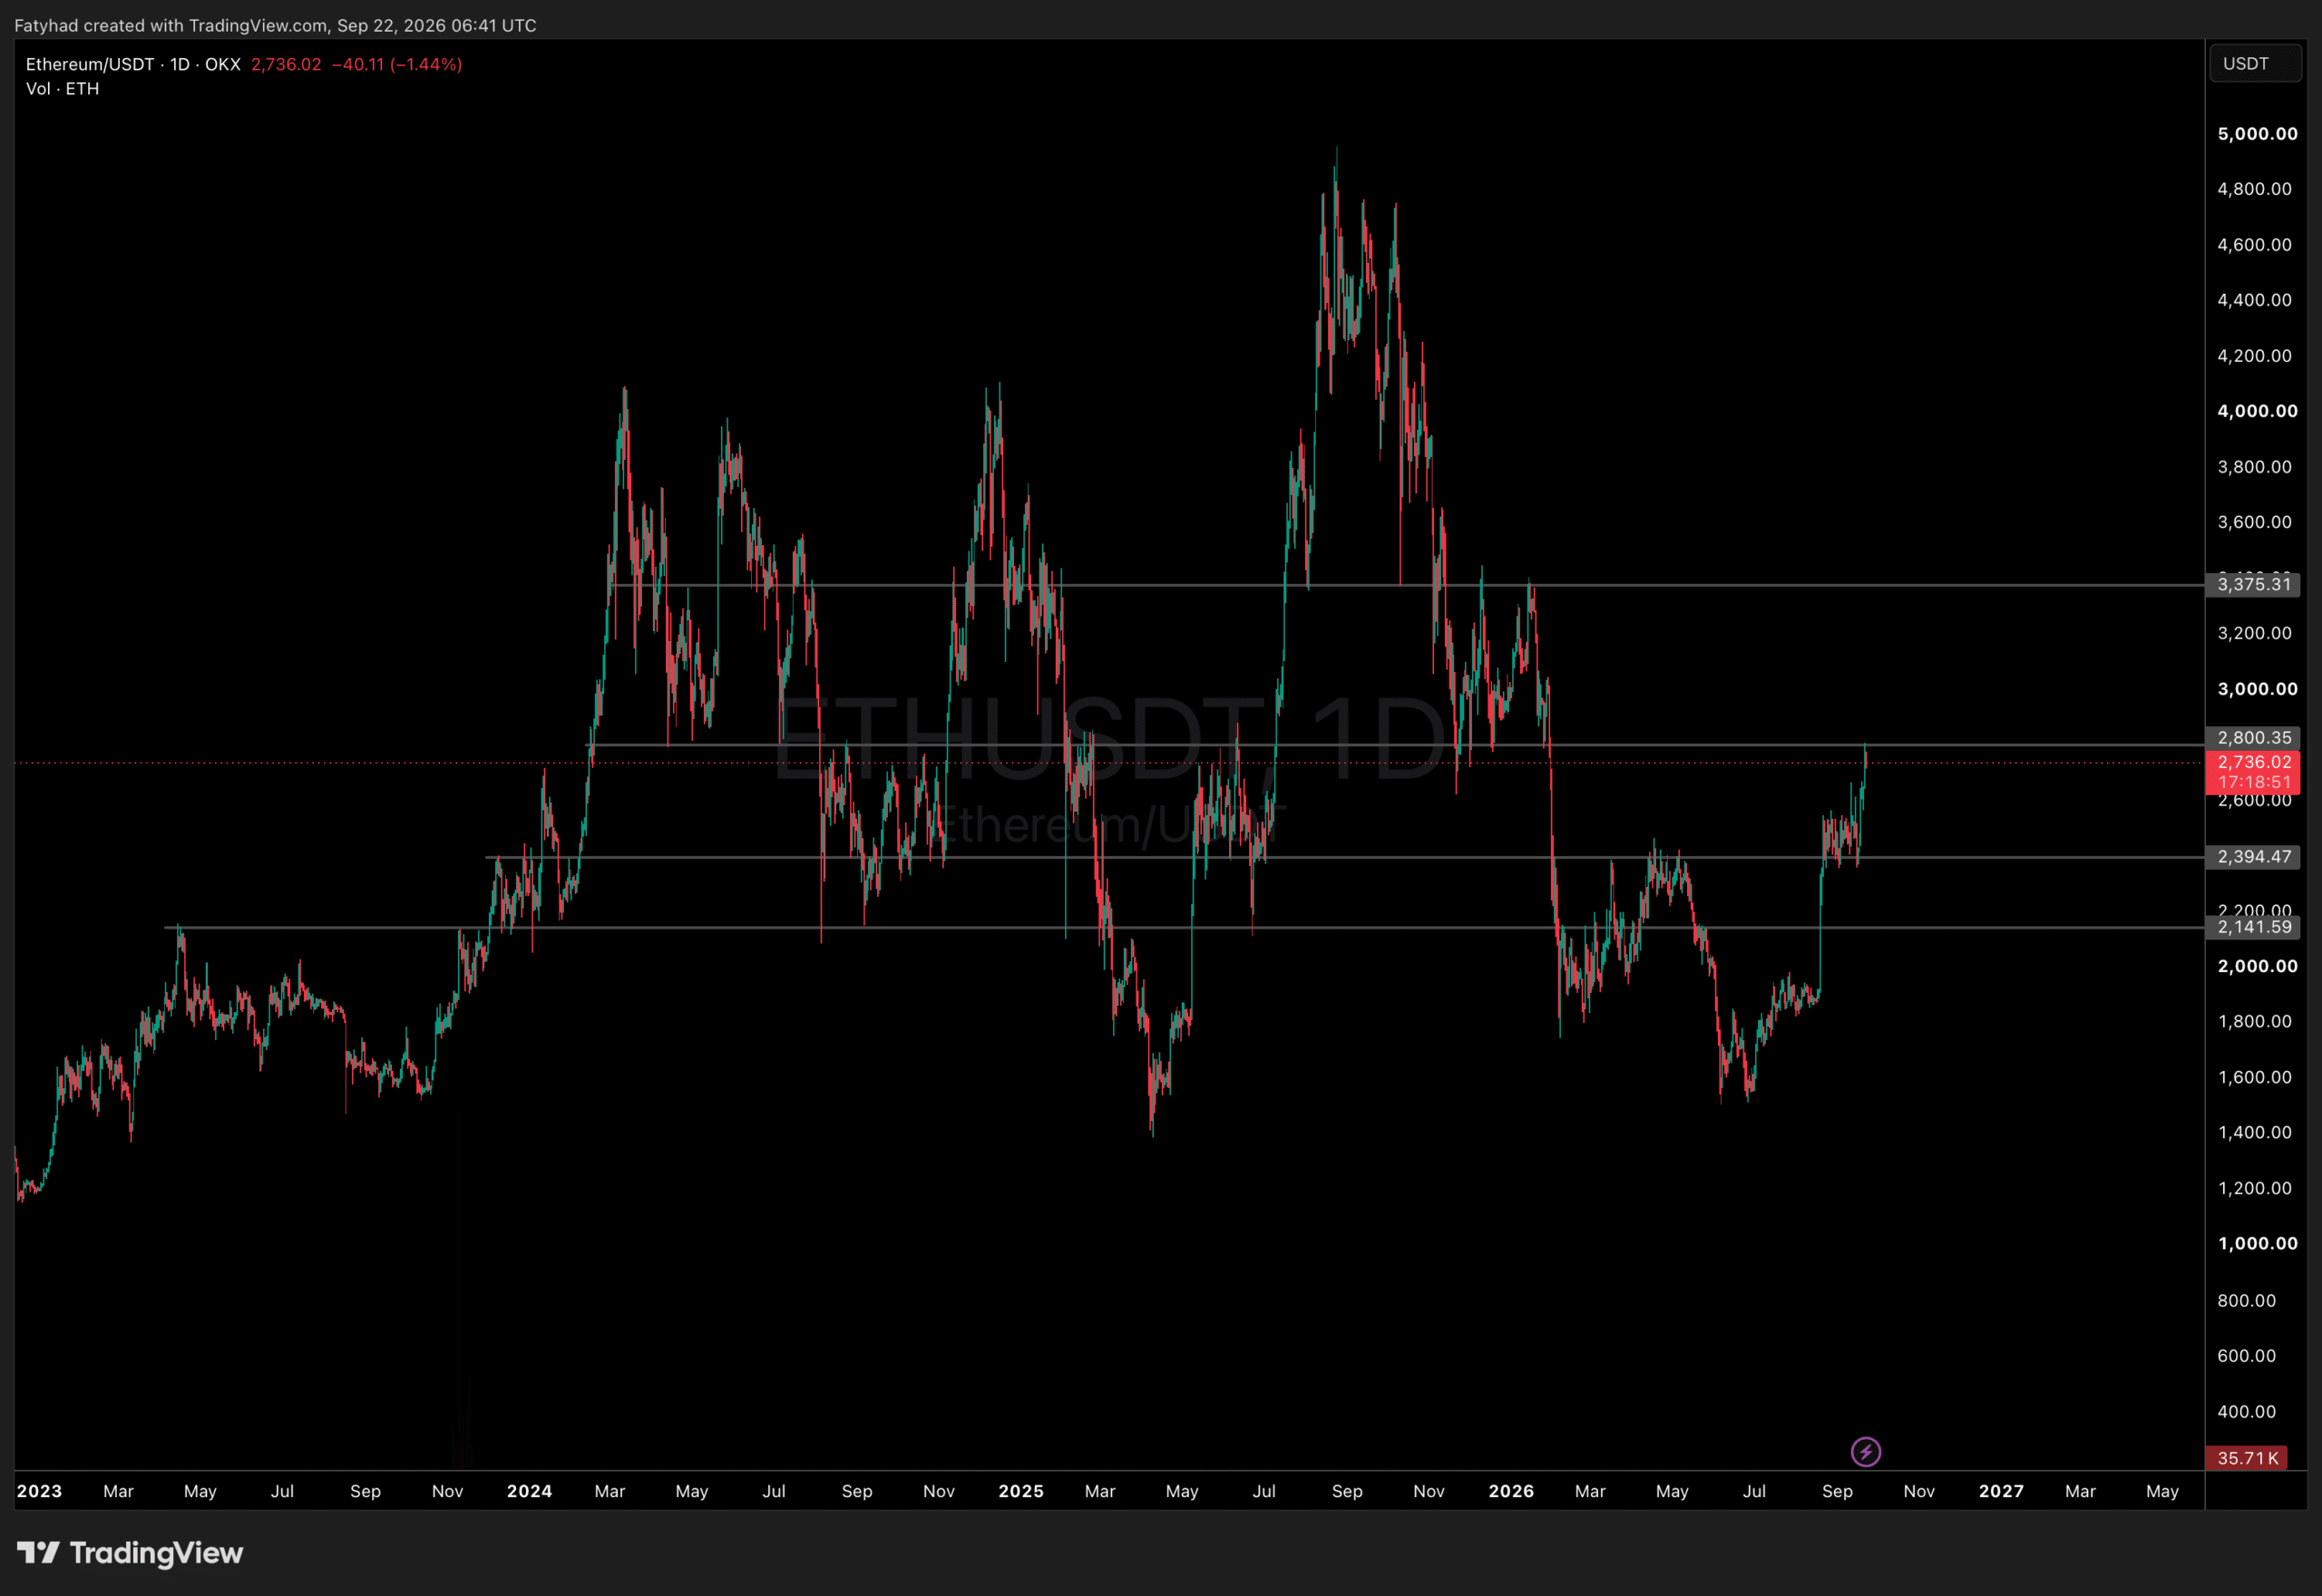
ETHUSDT Chart 1D TradingView
- Trend: ETH rebounded from about $1,510 in July to near $2,736, reclaiming levels lost in February. It cleared prior ceilings at $2,141 and $2,394, which now serve as support.
- Immediate resistance: $2,800. A daily close above this zone would mark a breakout from a level that has rejected price repeatedly since 2024.
- Next upside target: $3,375, the early-2026 ceiling, if $2,800 is reclaimed.
- Supports: $2,394 as primary support, then $2,141. A failure at $2,800 could trigger a pullback toward $2,400 before another attempt.
Market Implications
- Supply dynamics: exchange withdrawals at a three-year high indicate tighter sell-side liquidity. This strengthens the probability that dips attract buyers.
- Demand signals: ETF inflows are improving but uneven. The net effect remains supportive when combined with individual accumulation and staking.
- Risk: the 80% three-month rally increases the probability of a retest of support if $2,800 holds as resistance in the near term.
$BTC just hit $87,000.$ETH is trading above $2,800.
$750M worth of shorts liquidated in the past 12 hours.
We are mooning! pic.twitter.com/iHwIcn1P62
— CryptoGoos (@cryptogoos) September 21, 2026
This mysterious whale swapped another 200.71 $BTC ($17.2M) for 6,247 $ETH ($17.2M) today!
Over the past 6 days, the whale has swapped a total of 1,308 $BTC ($104M) for 40,670 $ETH and staked it all!https://t.co/HBzcwEnHth pic.twitter.com/fTVSy0Mwhg
— Lookonchain (@lookonchain) September 22, 2026
Authors credited by the source: Daniel Francis
Published by Holder based on an external source.