Bitcoin tests $87,000 resistance amid bullish moving average alignment
Bitcoin trades near $85,970 with minimal intraday change, while the broader structure indicates resilience: the current post-peak drawdown is the shallowest on record and coincides with a technical setup last seen in 2025. One year after its all-time high of $126,000, Bitcoin is down 32%. Historical comparisons: one year after prior peaks, declines were 69.7% in 2013, 82.3% in 2017, and 74.6% in 2021.
Bitcoin still consolidating below key resistance
In my opinion a matter of time before we break it and head back to the 6 digit real
bitcoin:native pic.twitter.com/2UVmnv0Tff
— Teddy (@TeddyCleps) October 6, 2026
Why this drawdown is shallower
On this day, one year ago, Bitcoin hit its ATH of $126,000. pic.twitter.com/pUIovNEfXv
— CoinGecko (@coingecko) October 6, 2026
Buyer composition shifted from retail leverage to institutional capital through ETFs, asset managers, and family offices. Institutional rebalancing mandates buy weakness to maintain target allocations, which dampens cascades. Elevated leverage was cleared early on October 10, 2025, with $19 billion in liquidations. Volatility declined from historical levels above 80% to about 40%. This cycle’s maximum drawdown to date: 53% near $59,000 in June, versus 77% to 85% in past cycles.
Technical signal last seen in 2025
BITCOIN BULLISH CROSSOVER! pic.twitter.com/5PYP48l1V3
— Crypto Rover (@cryptorover) October 6, 2026
All three moving averages are aligned in bullish order: 50-day at $79,495, 100-day at $79,493, and 200-day at $79,539. The 100-day crossing above the 200-day completes the alignment, a setup last recorded on June 24, 2025. Historical outcomes are mixed: October 2020 alignment at $13,600 preceded a run to $64,000; November 2023 at $35,000 preceded $73,000; June 2025 produced $106,000 to $112,000 over 97 days. The signal strengthens trend probability but does not ensure continuation.
Corporate flows reinforce the structure: Strive purchased 2,000 BTC for approximately $169 million at an average of $84,422, raising holdings to 29,462 BTC. Strategy added 334 BTC for $28.7 million at $85,839, pushing total above 848,000 BTC and recording a $20.91 billion digital asset gain for the third quarter.
Key levels and confirmation
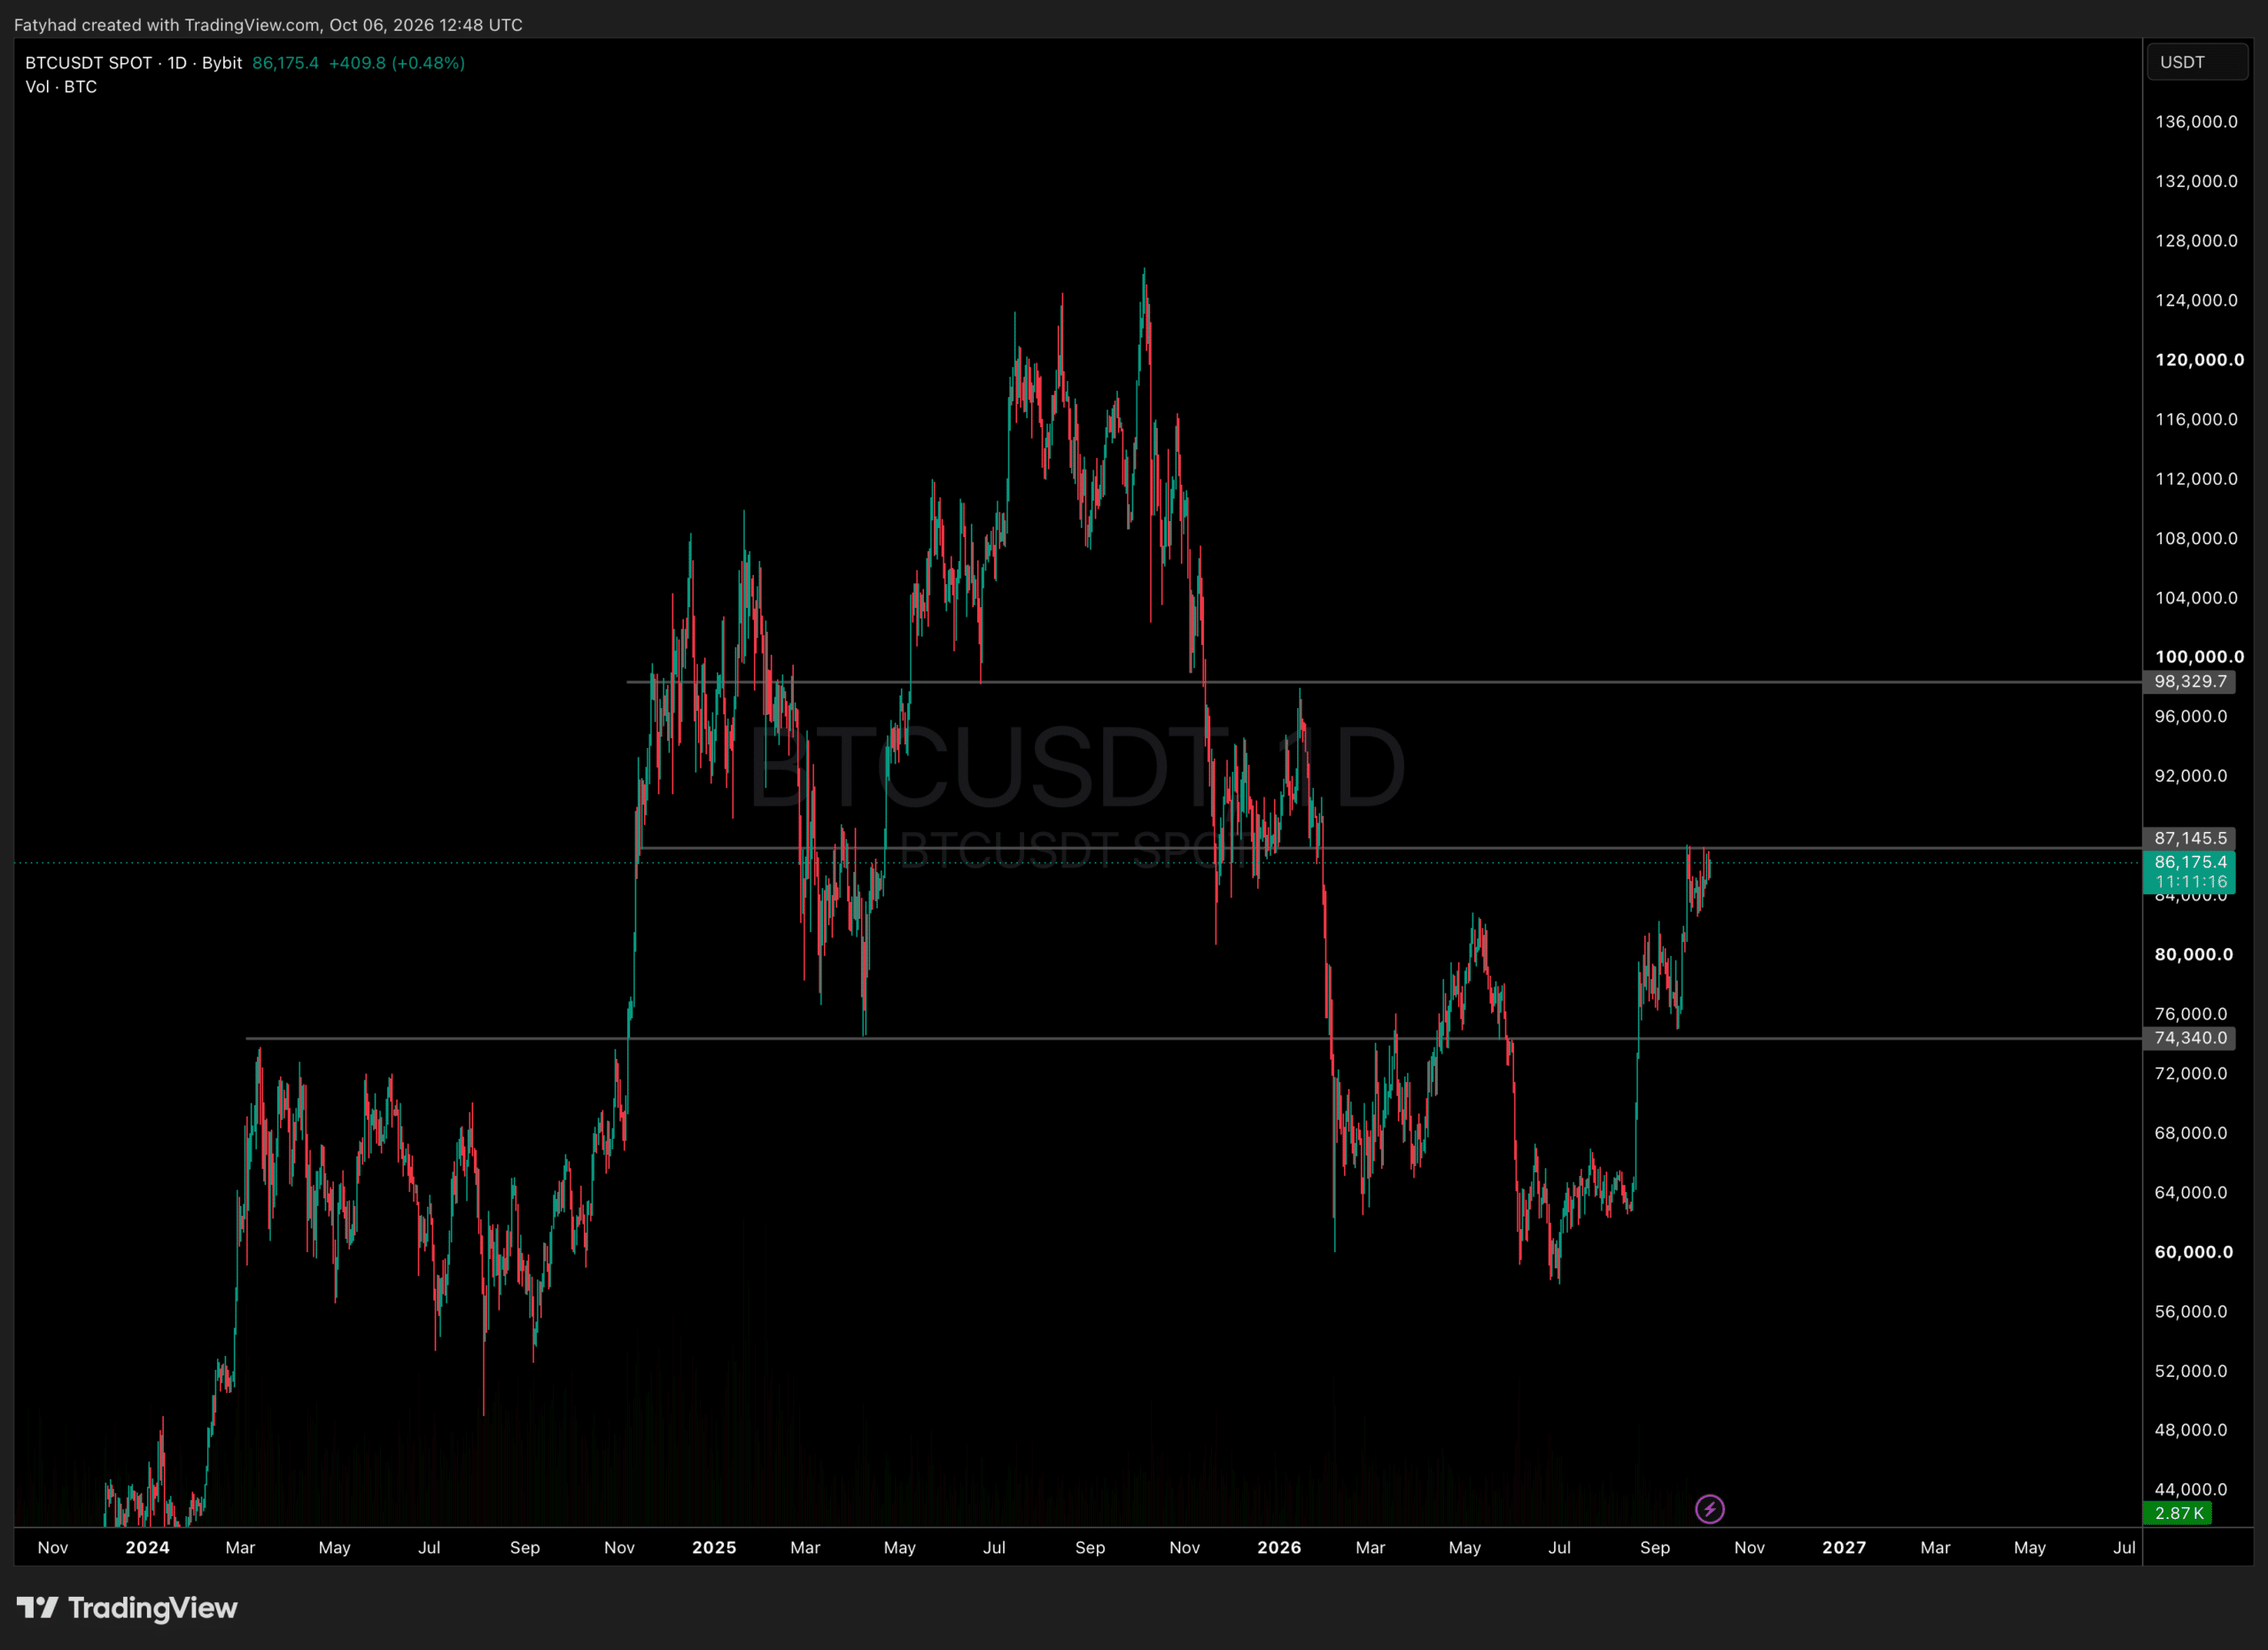
BTCUSDT Chart 1D TradingView
- Structural floor: $79,500, where the 50-, 100-, and 200-day moving averages cluster. Holding above on pullbacks validates the recovery structure.
- Ceiling: $87,000. Two recent rejections. A daily close above confirms a breakout from consolidation.
- Immediate target: $90,000. A liquidation cluster for short positions and a potential acceleration zone.
Risks: a shallow drawdown does not ensure stability. Rising Treasury yields could pressure prices. Until $87,000 is cleared, alignment and institutional buying build a case rather than confirm it.
Authors credited by the source: Daniel Francis
Published by Holder based on an external source.