Bitcoin forms 3-day death cross, history points to $33,500 bottom
Ali Martinez flags new BTC 3‑day death cross, warns of room for another ~49% drop toward ~$33.5k
A new death cross has appeared on the 3‑day chart of Bitcoin. Analyst Ali Martinez says this signal has preceded the final leg down in past cycles.
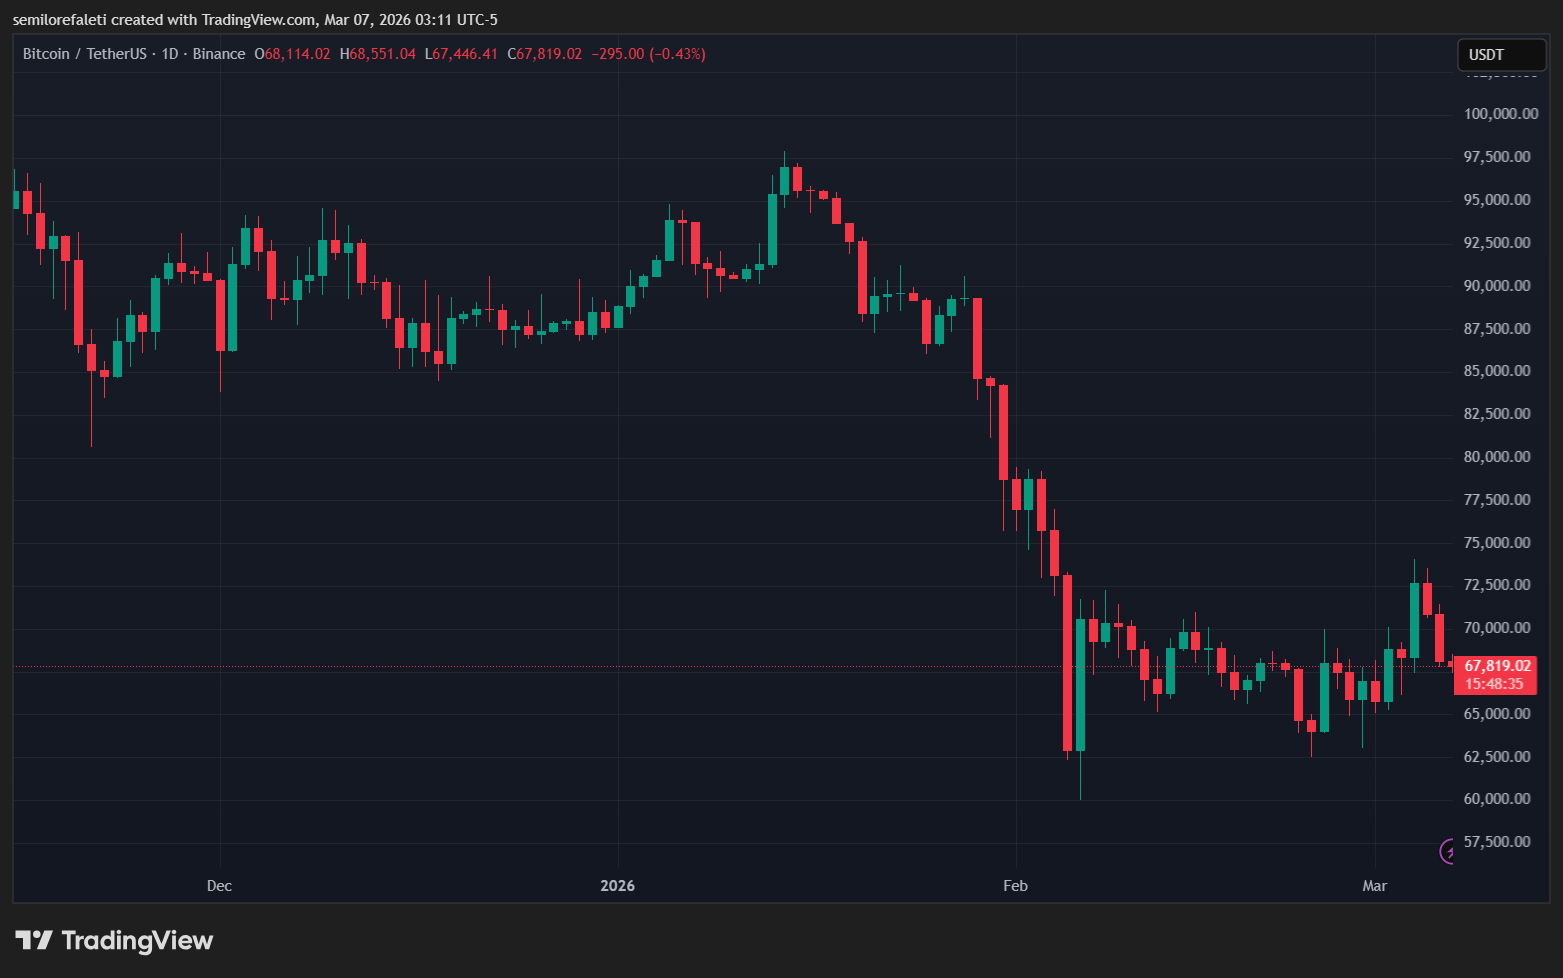
BTC still sits below $70k after a brief breakout this week. The market has mostly stayed in the $60k–$70k band lately.
In a March 6 post, Martinez highlights the 50/200 simple moving average crossover on the 3‑day timeframe as his key macro gauge. He notes that when the 50‑day falls below the 200‑day, downside often continues before a cycle bottom forms (source).
What history shows:
- 2013: BTC fell 72% before the cross, then slid another 52% after it (source).
- 2017: −67% before, then −50% after the cross (source).
- 2022: Cross in May with BTC already −58%, followed by another −46% (source).
Martinez says a fresh 3‑day death cross has now printed. Based on those precedents, he sees risk of an average additional 49% decline, which would place a potential bottom near $33,500. He adds this is not a guarantee, only a historical pattern linked with macro bottoms (source).