Bitcoin holds $82,300 support after $16B options expiry clears
Bitcoin absorbed the largest options expiry of the cycle without significant volatility: $15.9 billion in BTC options and $2.13 billion in ETH options expired on Deribit, totaling $16.53 billion. Post-expiry, hedging pressures are reduced, creating a cleaner tape for spot-driven moves. Bitcoin trades near $84,590, up 1.41% in 24 hours. Reported volume is $34.31 billion, down 27.13%, consistent with typical post-expiry activity declines.
Options Structure and Positioning
Max pain clustered at $75,000 to $78,000 while spot held above that range. Max pain marks the level where the most options expire worthless, benefiting option sellers. The gap indicates prior positioning was misaligned: Bitcoin fell to $75,000 last week, then rallied above $87,000, pushing many near-$76,000 expiries deep in the money. The put-to-call ratio ranged from 0.69 to 0.84, indicating a call-heavy skew and a bullish lean into expiry. This setup implies sellers defended lower levels rather than driving price downward.
🚨 Nearly $16 BILLION in #Bitcoin options notional expired this morning.
Why does that matter?
Large options expiries can influence short term price action as dealers adjust their hedges around heavily concentrated strike prices.
That can contribute to:
– Price gravitating…
— Nebraskangooner (@Nebraskangooner) September 25, 2026
Post-Expiry Dynamics
Expiry days often pin price as dealers hedge gamma by trading spot to stay delta-neutral. After settlement, those hedges unwind, allowing price to reflect net demand. U.S.-listed Bitcoin ETFs reported sustained inflows: $190.7 million on September 24 led by BlackRock’s IBIT at $162.6 million, following $346.9 million on September 23 and $714.7 million on September 22. Total ETF net assets: $111.28 billion. Cumulative inflows since launch: $57.87 billion.
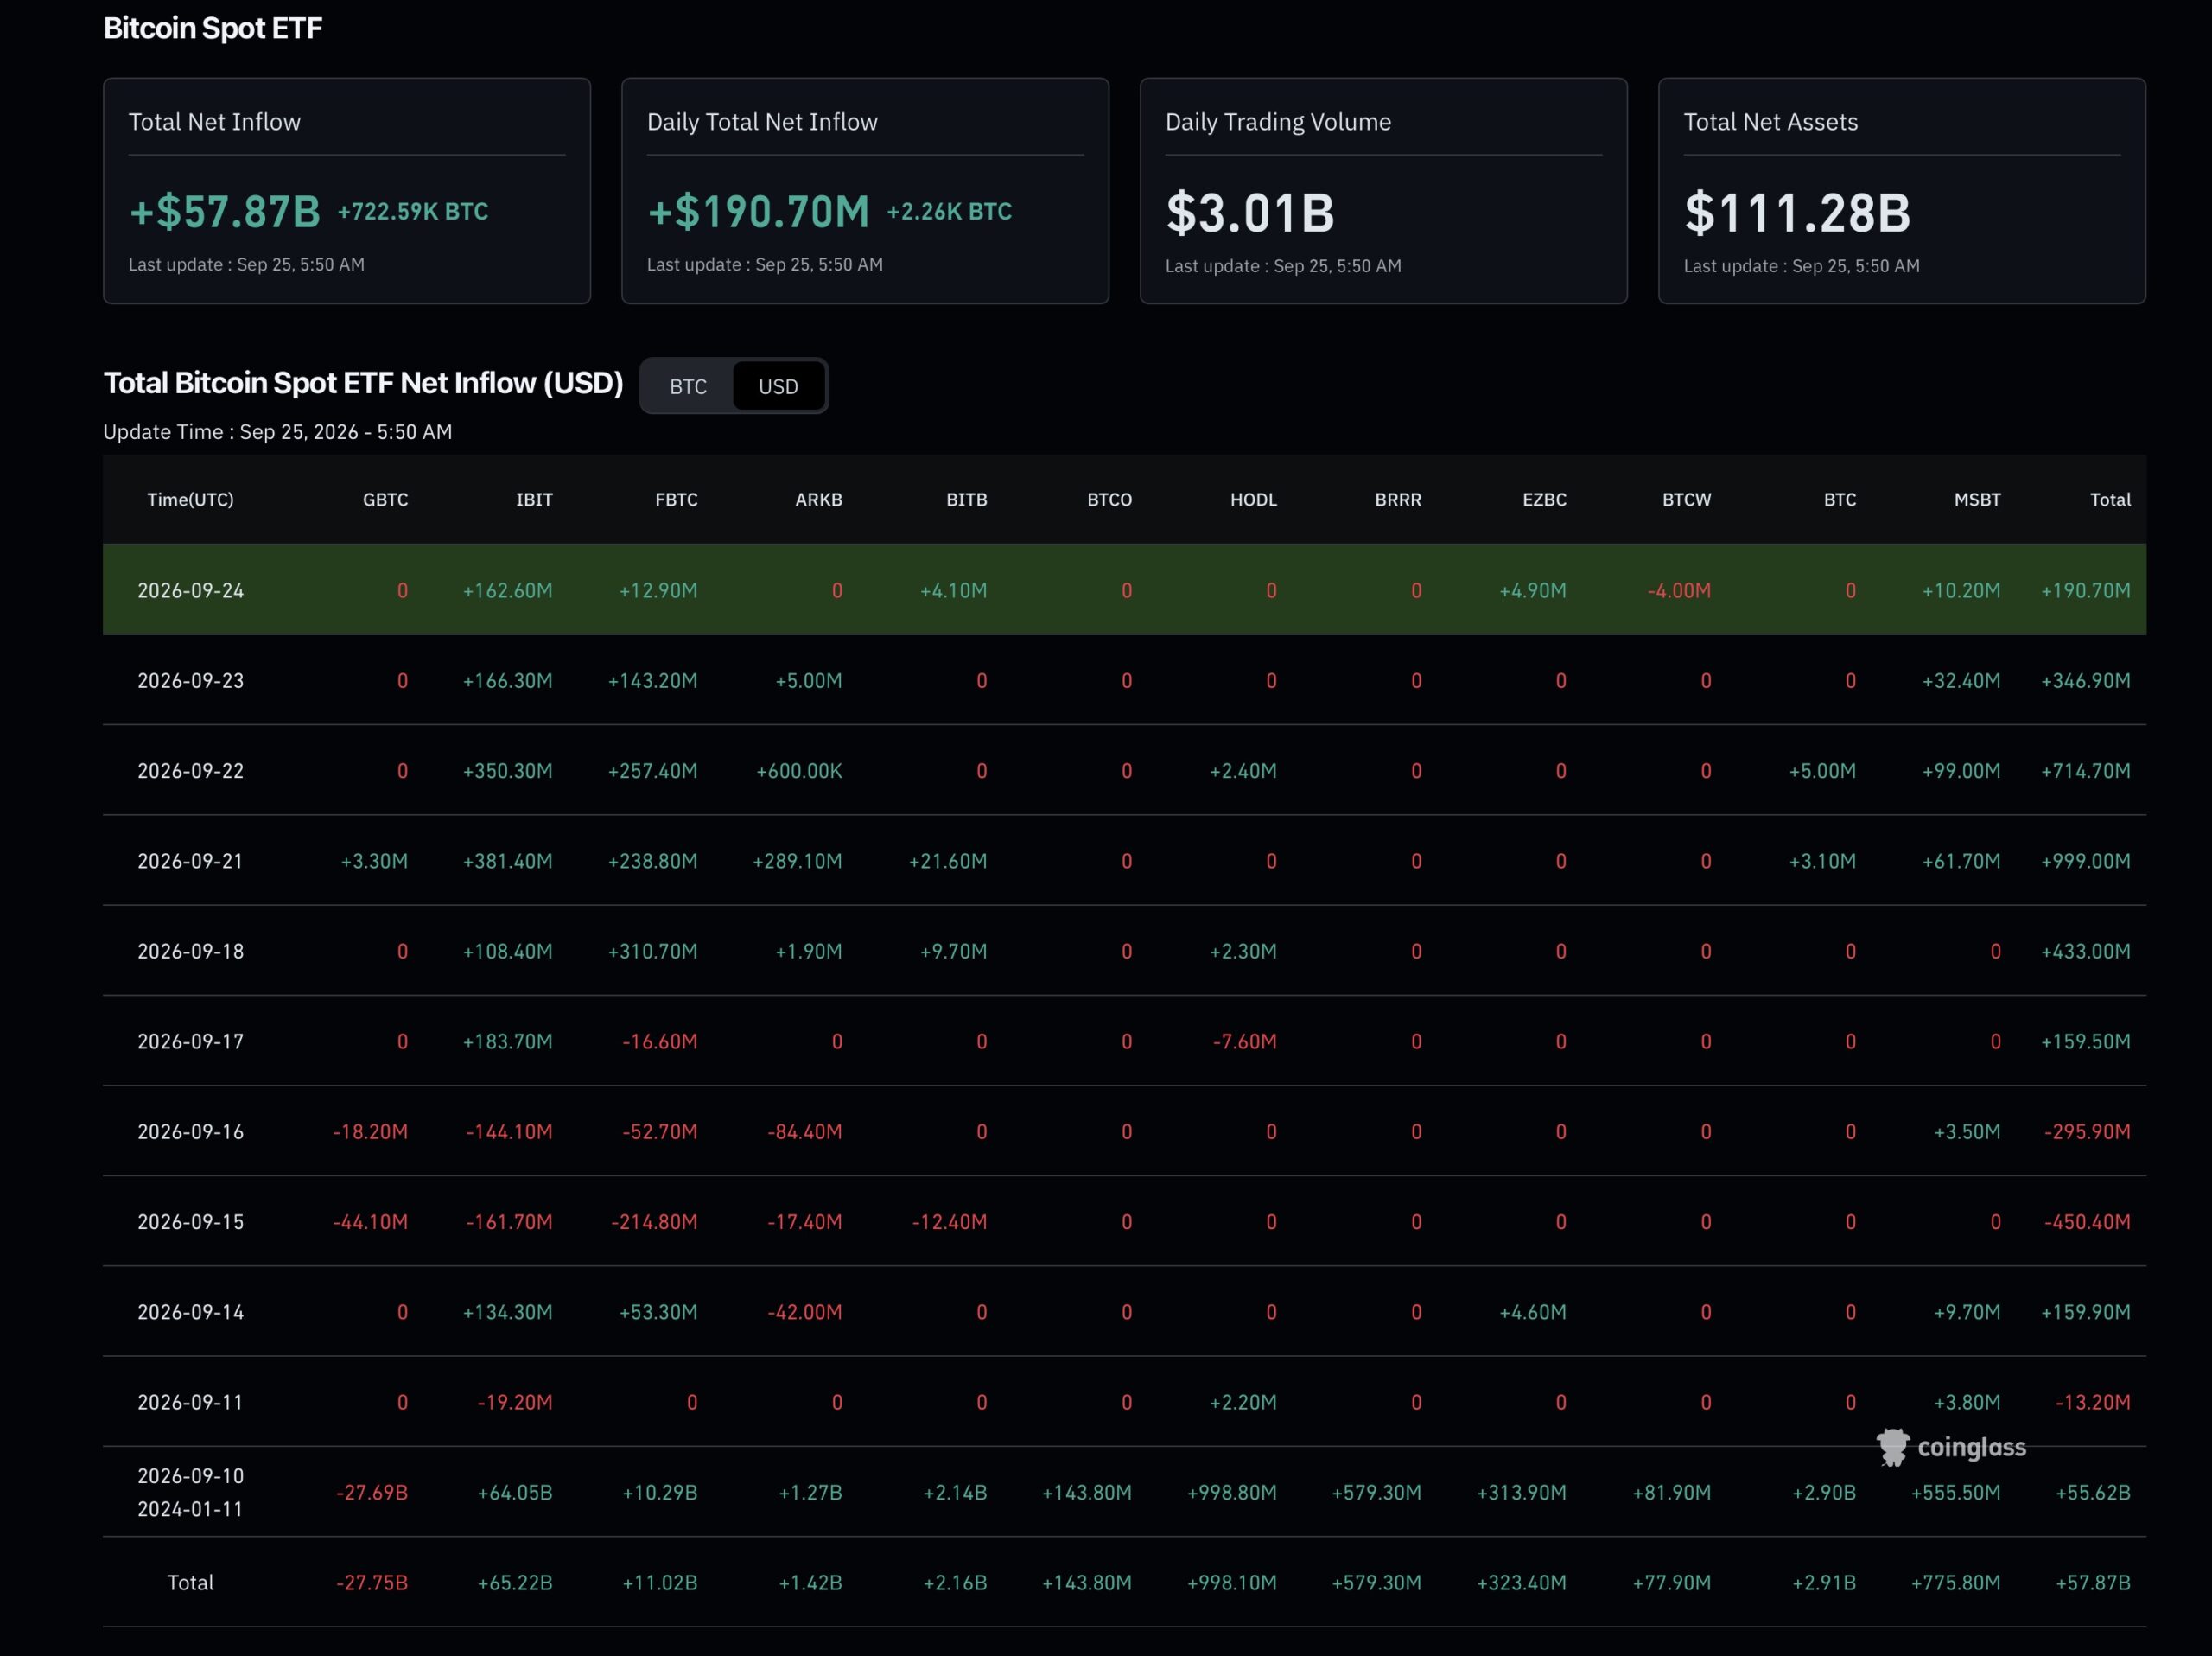
Total Bitcoin Spot ETF Net Inflow Coinglass
Options positioning signals a bullish bias beyond expiry: traders built butterfly structures pointing to $95,000 targets by October 30. Deribit open interest exceeded $50 billion, with about one-third clearing in this cycle.
Technical Levels and AI-Flagged Ranges
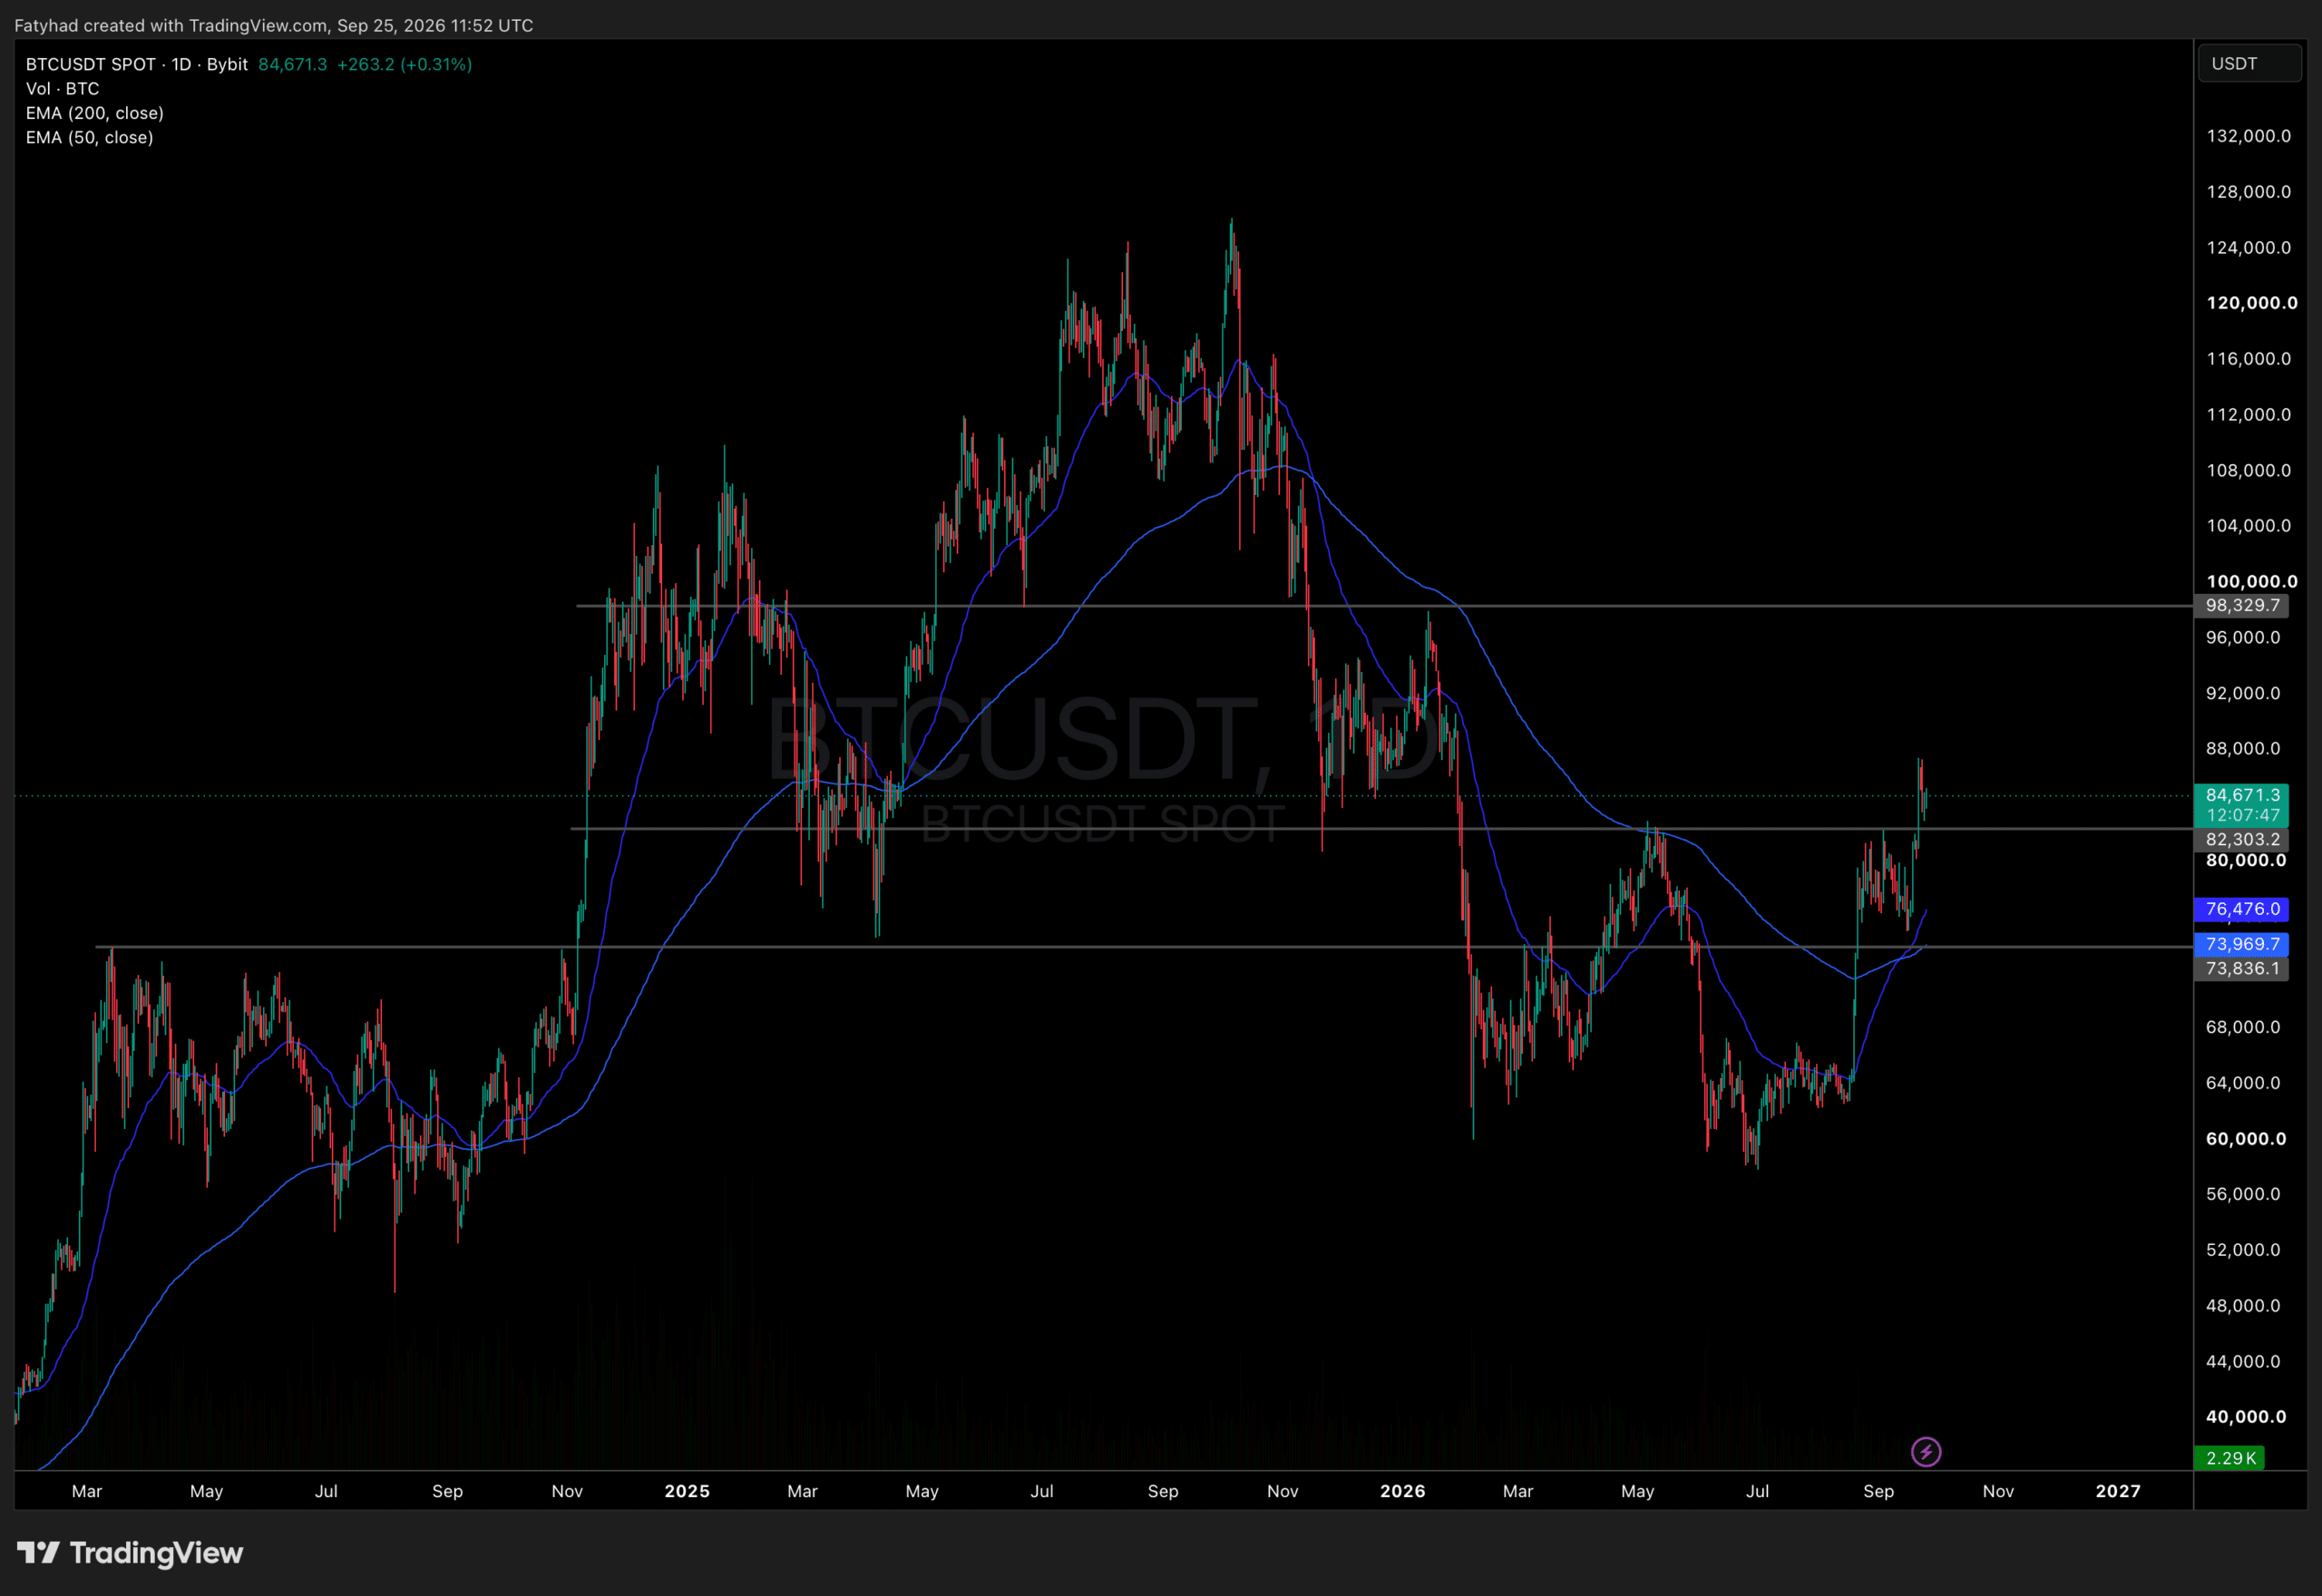
BTCUSDT Price Chart 1D
Structure: Bitcoin holds above $82,303, a prior rejection level in May and September. The 50-day EMA at $76,476 crossed above the 200-day EMA at $73,970.
- Key support: $82,300. Daily closes above this level preserve the uptrend structure.
- Near-term resistance: $88,000 to $90,000. A break opens the path to the $95,000 area aligned with options targets.
- Higher objective: $98,330, the last hurdle ahead of $100,000. On weakness, $73,836 and the 200-day EMA define the backstop that has held pullbacks since August.
Risk: Expiry removes both ceiling and floor effects. Dealers no longer need to buy dips for hedging, and post-expiry liquidity often thins, amplifying moves.
Confirmation: Monitor the next daily closes. Holding $82,300 alongside continued ETF inflows increases the probability of a test of $88,000 to $90,000.