

Bitcoin falls below $62,000 after Anthropic IPO amid stock sell-off
Bitcoin failed to stage a post-Anthropic IPO rebound. BTC closed at $61,987 on November 19 and dipped to about $61,800 the following morning as US equities fell roughly 2%. Correlated crypto equities weakened: MicroStrategy and Bitmine extended intraday losses, with both down more than 88% from record highs.
Anthropic’s debut: IPO priced at $83, opened at $111.50, closed at $97.17. The S&P 500 fell 2.0% and the Nasdaq Composite 2.3% after opening higher. Risk-off equity action coincided with BTC’s decline to an intraday low near $61,428, and $61,291 the next day.
BREAKING: MicroStrategy, $MSTR, and Bitmine, $BMNR, extend losses to their lowest level of the day as Bitcoin falls below $63,000.
The stocks are now down -88% and -91%, respectively, from their record highs. pic.twitter.com/BgxojZPDps
— The Kobeissi Letter (@KobeissiLetter) November 19, 2026
Equity-led risk-off explains crypto weakness
- Stocks: Dow down about 1,100 points, S&P 500 logged a sixth straight daily loss. Concerns emerged about durability of AI-driven spending.
- Anthropic: closed 17% above the $83 offer but 13% below the open, leaving intraday buyers with losses.
- Bitcoin: down 1.7% on the day, with fresh lows near $61.3k into Friday.
Correlation with tech equities remains a primary driver of near-term crypto direction.
SpaceX analogue: pre-IPO slide rhymes, early bounce does not
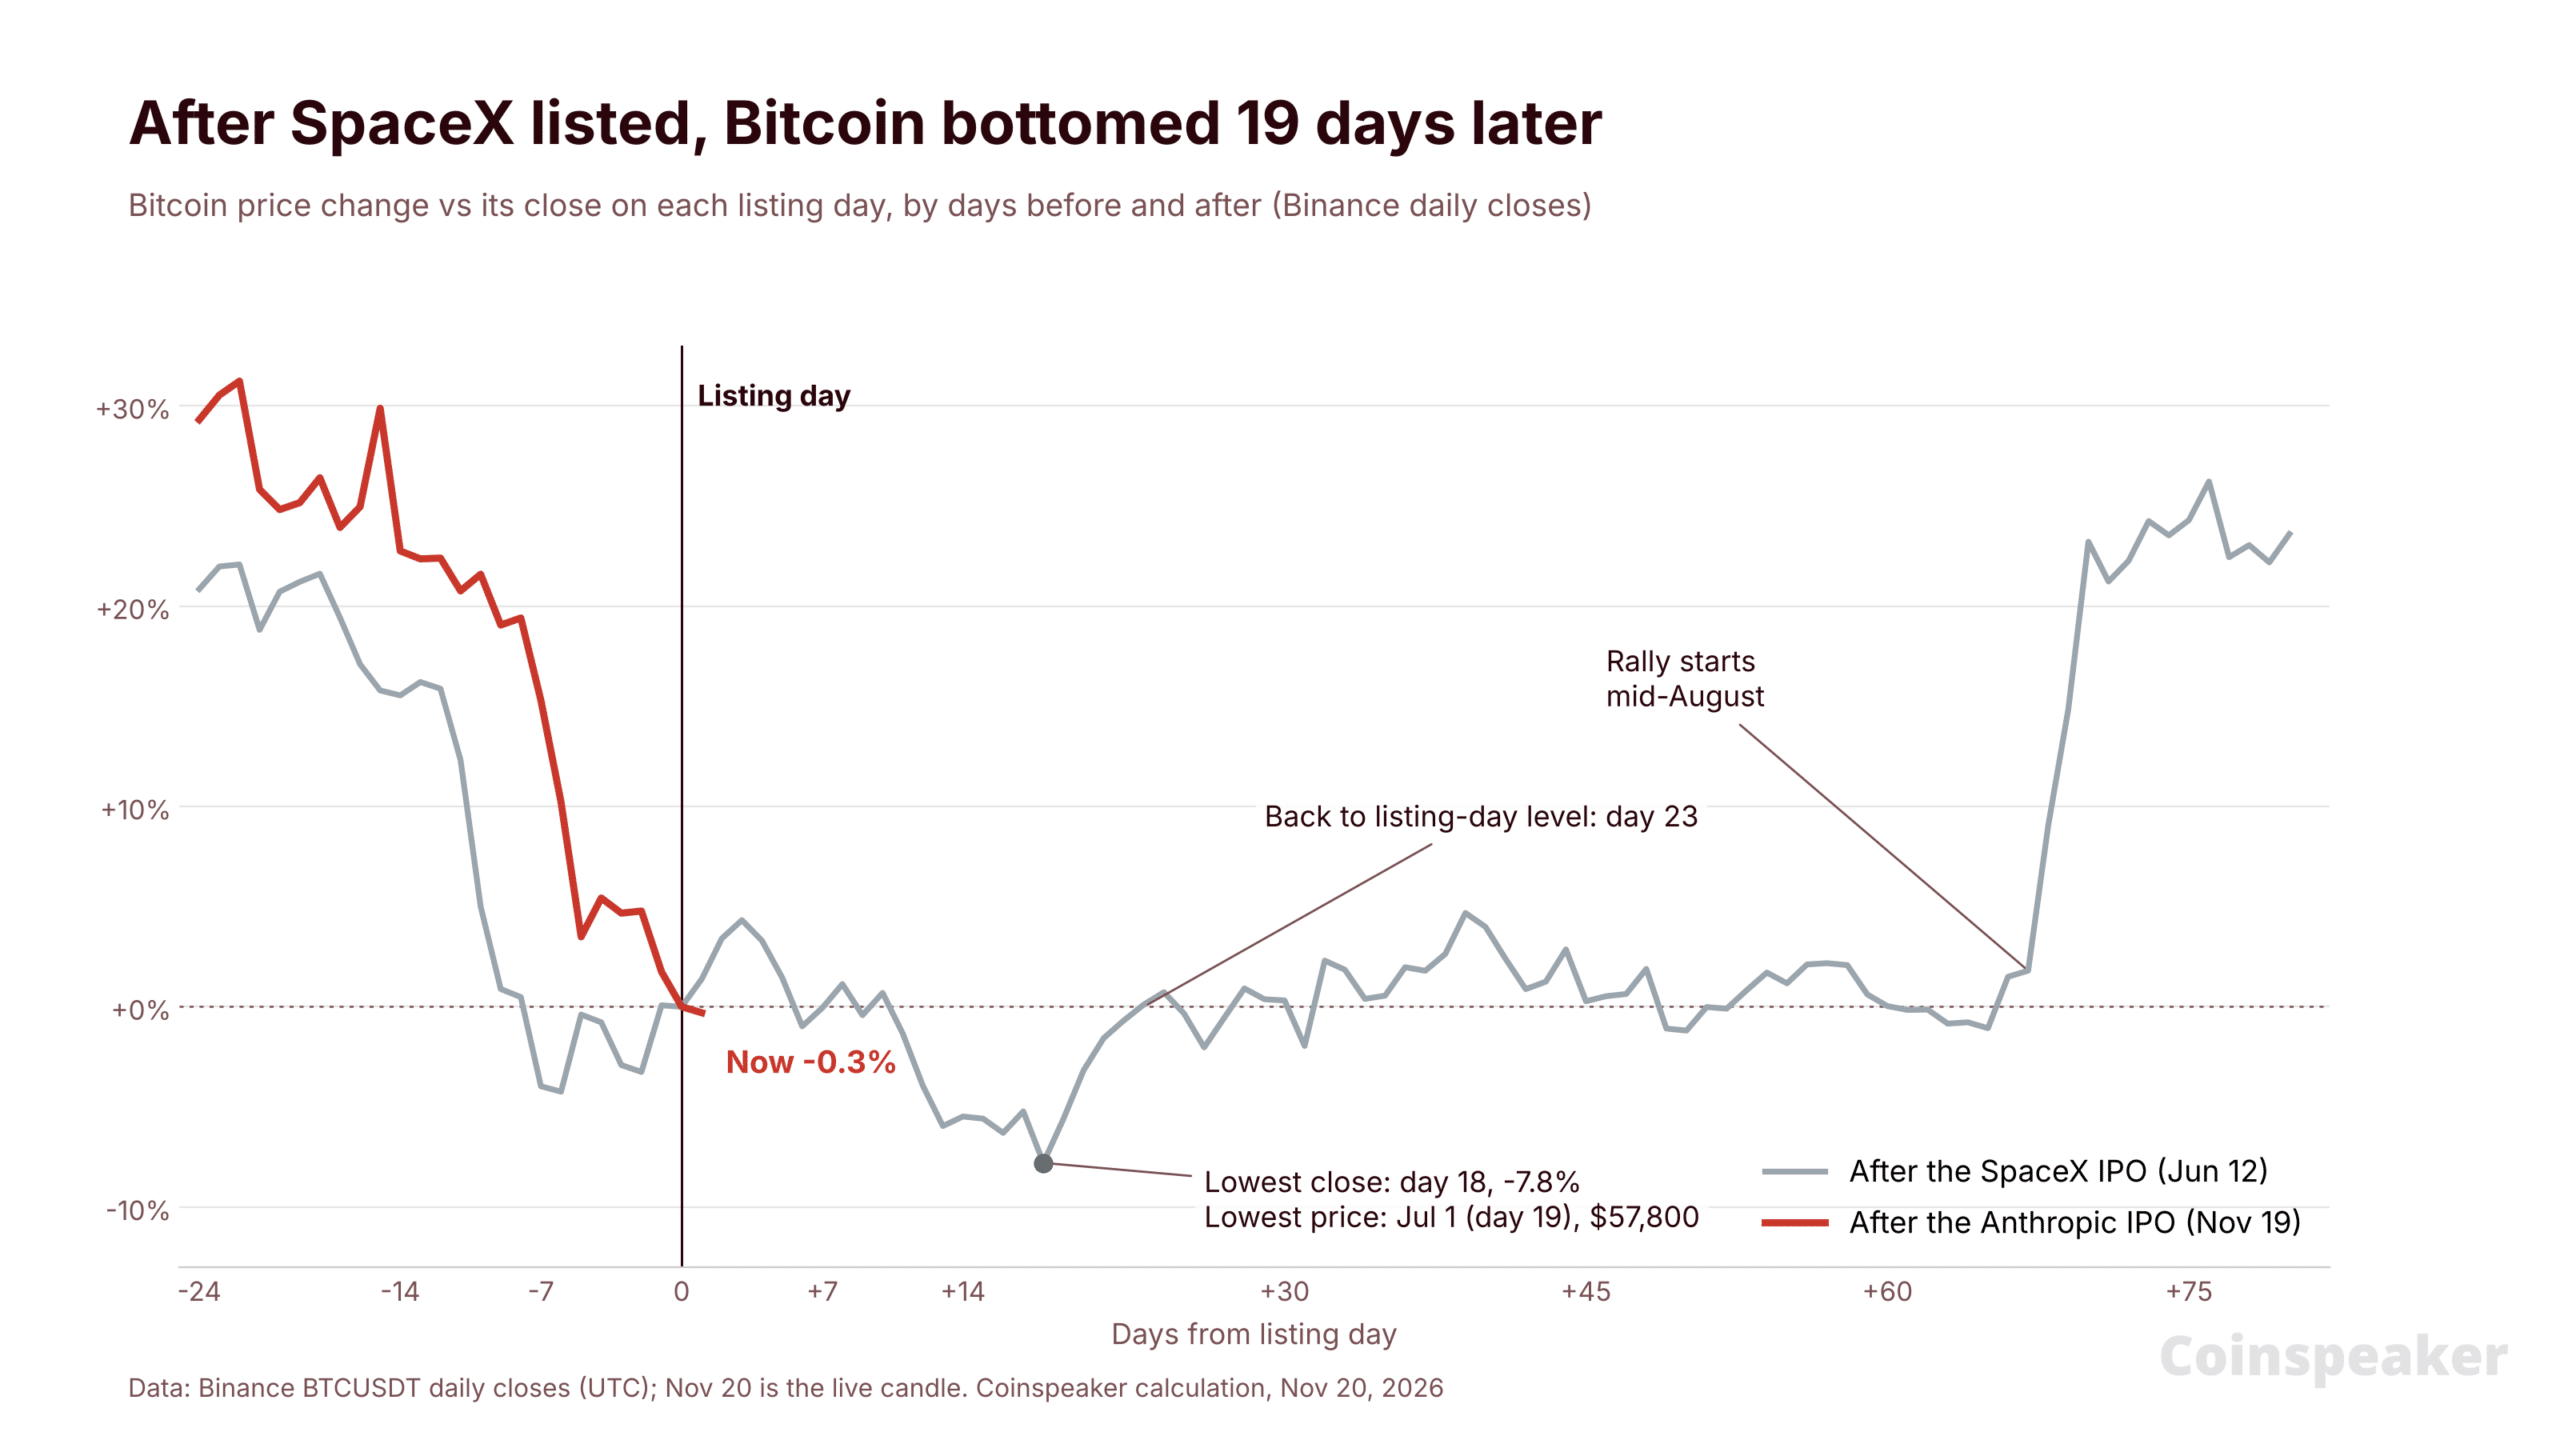
Comparison window: aligned BTC’s path from 24 days pre-listing through 80 days post-listing for SpaceX’s June debut and Anthropic’s November debut.
- Pre-listing drawdown: −17% into SpaceX vs −23% into Anthropic, trajectories similar.
- First days: post-SpaceX, BTC rebounded about 4% by day three alongside a 1.7% S&P 500 rise. Post-Anthropic, no bounce.
- Bottom after SpaceX: $57,800 on July 1, 19 days after listing and 9% below listing-day close. Reclaimed listing-day level by day 23, then range-bound for six weeks before rallying into mid-August.
Anthropic track mirrors SpaceX except for the missing early bounce.
What aligns and what differs now
- Aligns: a roughly 20% pre-IPO BTC decline; the SpaceX timing implies a potential bottom about three weeks after listing, pointing to early December.
- Differs: equities are weaker with six straight S&P 500 declines; AI leaders are dragging; markets are pricing a possible December Fed hike; BTC already lost the $62,300 floor that held since February.
Implication: if the SpaceX pattern holds, weakness may persist into early December with subsequent range-bound trading. If equities keep falling, the bottom could arrive sooner and lower.
Bitcoin technicals: $62,300 flips to resistance
Spot: $61,865. Below the 50-day EMA at $74,655 and the 200-day EMA at $75,470.
- Resistance: $62,300, a former multi-month floor, then $65,500.
- Support: $58,500. Below that: $57,800, the July 1 low.
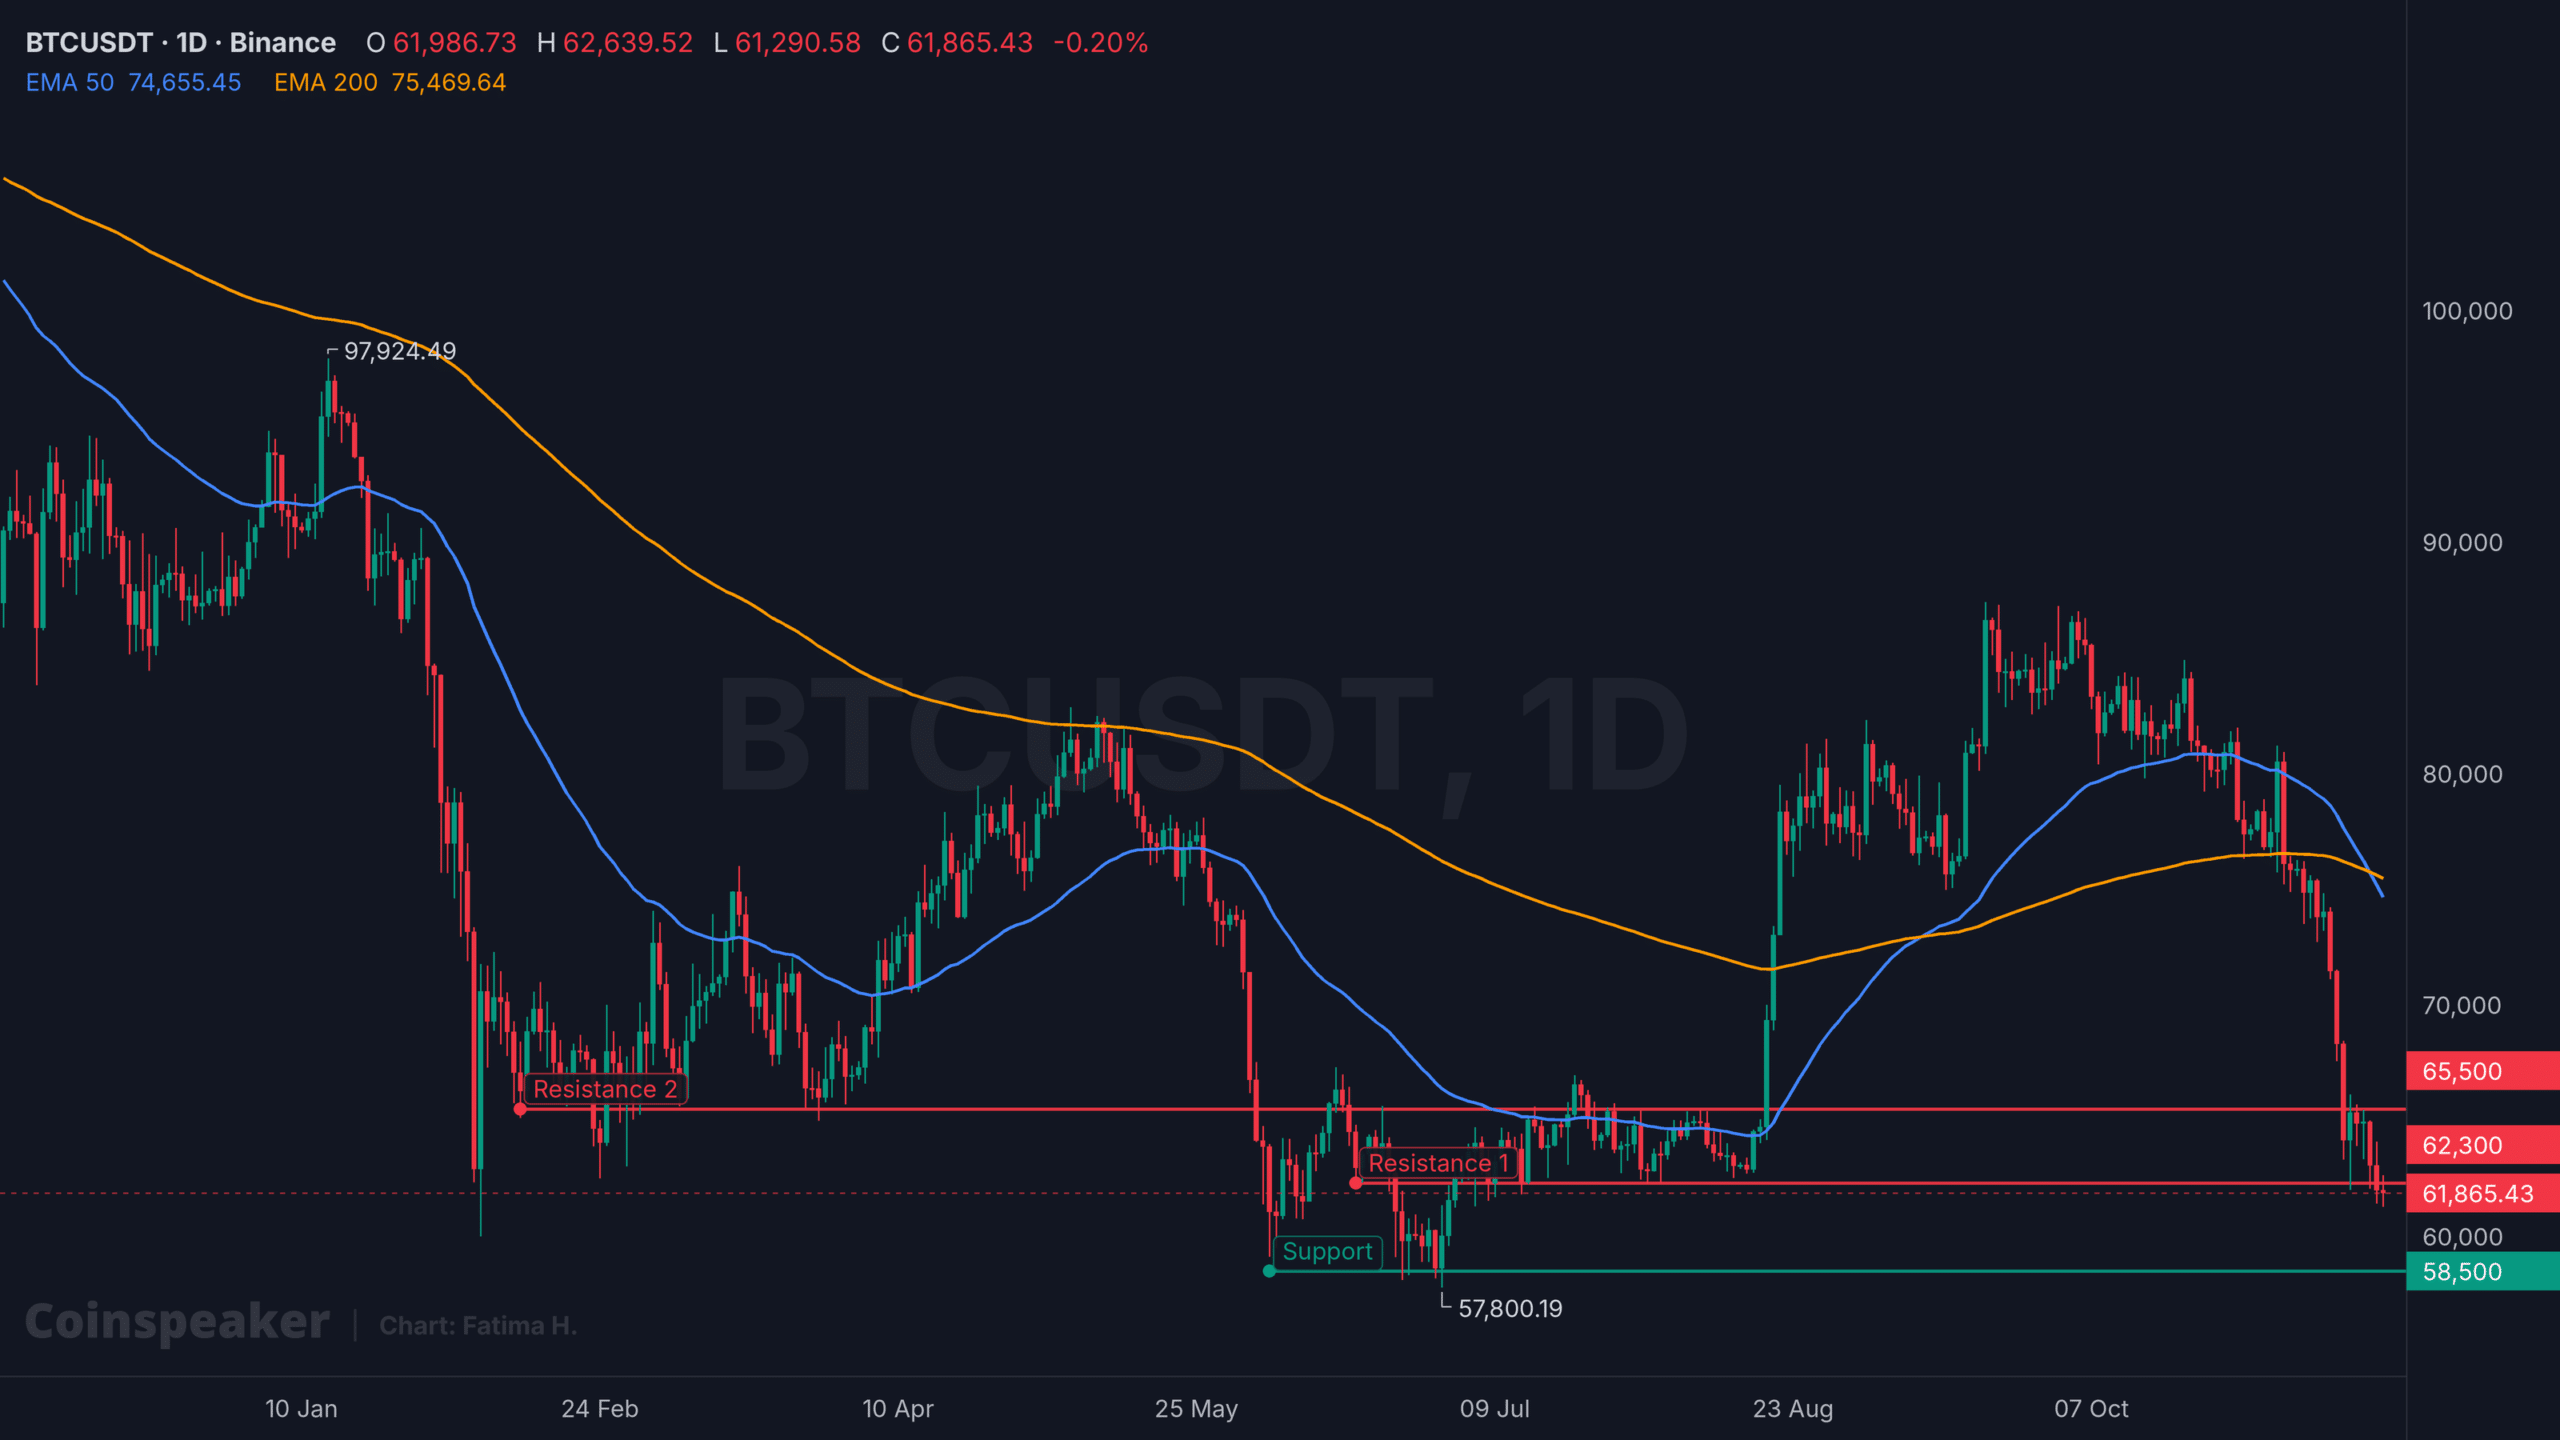
BTCUSDT 1D chart. Source: TradingView
| Outlook | Trigger | Level to watch |
|---|---|---|
| Rebound | Daily close back above $62,300 | $65,500 |
| Holding pattern | Range between $58,500 and $62,300 | Sideways similar to post-SpaceX |
| Sell-off | Daily close below $58,500 | $57,800, then lower if equities weaken |
Base case: stocks drive near-term crypto direction. A stabilization in equities alongside a BTC hold near $58,500 in early December would resemble June. A break below $57,800 during continued equity weakness would indicate a broader risk-off move beyond a single IPO catalyst.
Authors credited by the source: Daniel Francis
Published by Holder based on an external source.