Bitcoin ends Q3 strong as ETFs flip negative to start October
Bitcoin closed September up 6.33% while the S&P 500 was flat and gold fell more than 6%. Traders label October as Uptober based on historical gains, but current ETF flows turned negative and the month opened flat. Claude AI projects Bitcoin holding its current structure into October, with seasonal strength weaker than headline averages.
September Performance and Divergence
BTC trades near $83,423, down 0.23% on the day; October is -0.06% so far. Since 2013, October’s average BTC gain is 18.49% and median is 12.73%, historically the strongest month.

BTC SPX GOLD Santiment
Over the past five weeks, Bitcoin rose about 7% versus the S&P 500’s 0.3% in September and gold’s -6.5%. This marks a decoupling from earlier 2026 behavior when BTC tracked tech stocks or gold. Q3 closed with a quarterly candle that engulfed Q2’s range. Monthly gains: July 7.36%, August 24.95%, September 6.33%.
BREAKING: Bitcoin and Ethereum just printed their highest monthly close of 2026.$BTC surged +$25,800 and 44% in the past 3 months, delivering the best Q3 returns since 2017.$ETH surged 71.2% in the same period, its best quarter in history.
Macro indicators confirm crypto has… pic.twitter.com/hY1Z195n2m
— Bull Theory (@BullTheoryio) October 1, 2026
Seasonality: Strength With Caveats
October’s 18.49% average is skewed by early-years outliers: 60.79% in 2013 and 47.81% in 2017 amid smaller, less liquid markets. The 12.73% median is a more reliable guide. Recent outcomes are mixed: October 2024 +10.76%, October 2025 -3.69%. Three of the last thirteen Octobers were negative. Favorable but not assured.
Flows and Current Market Context
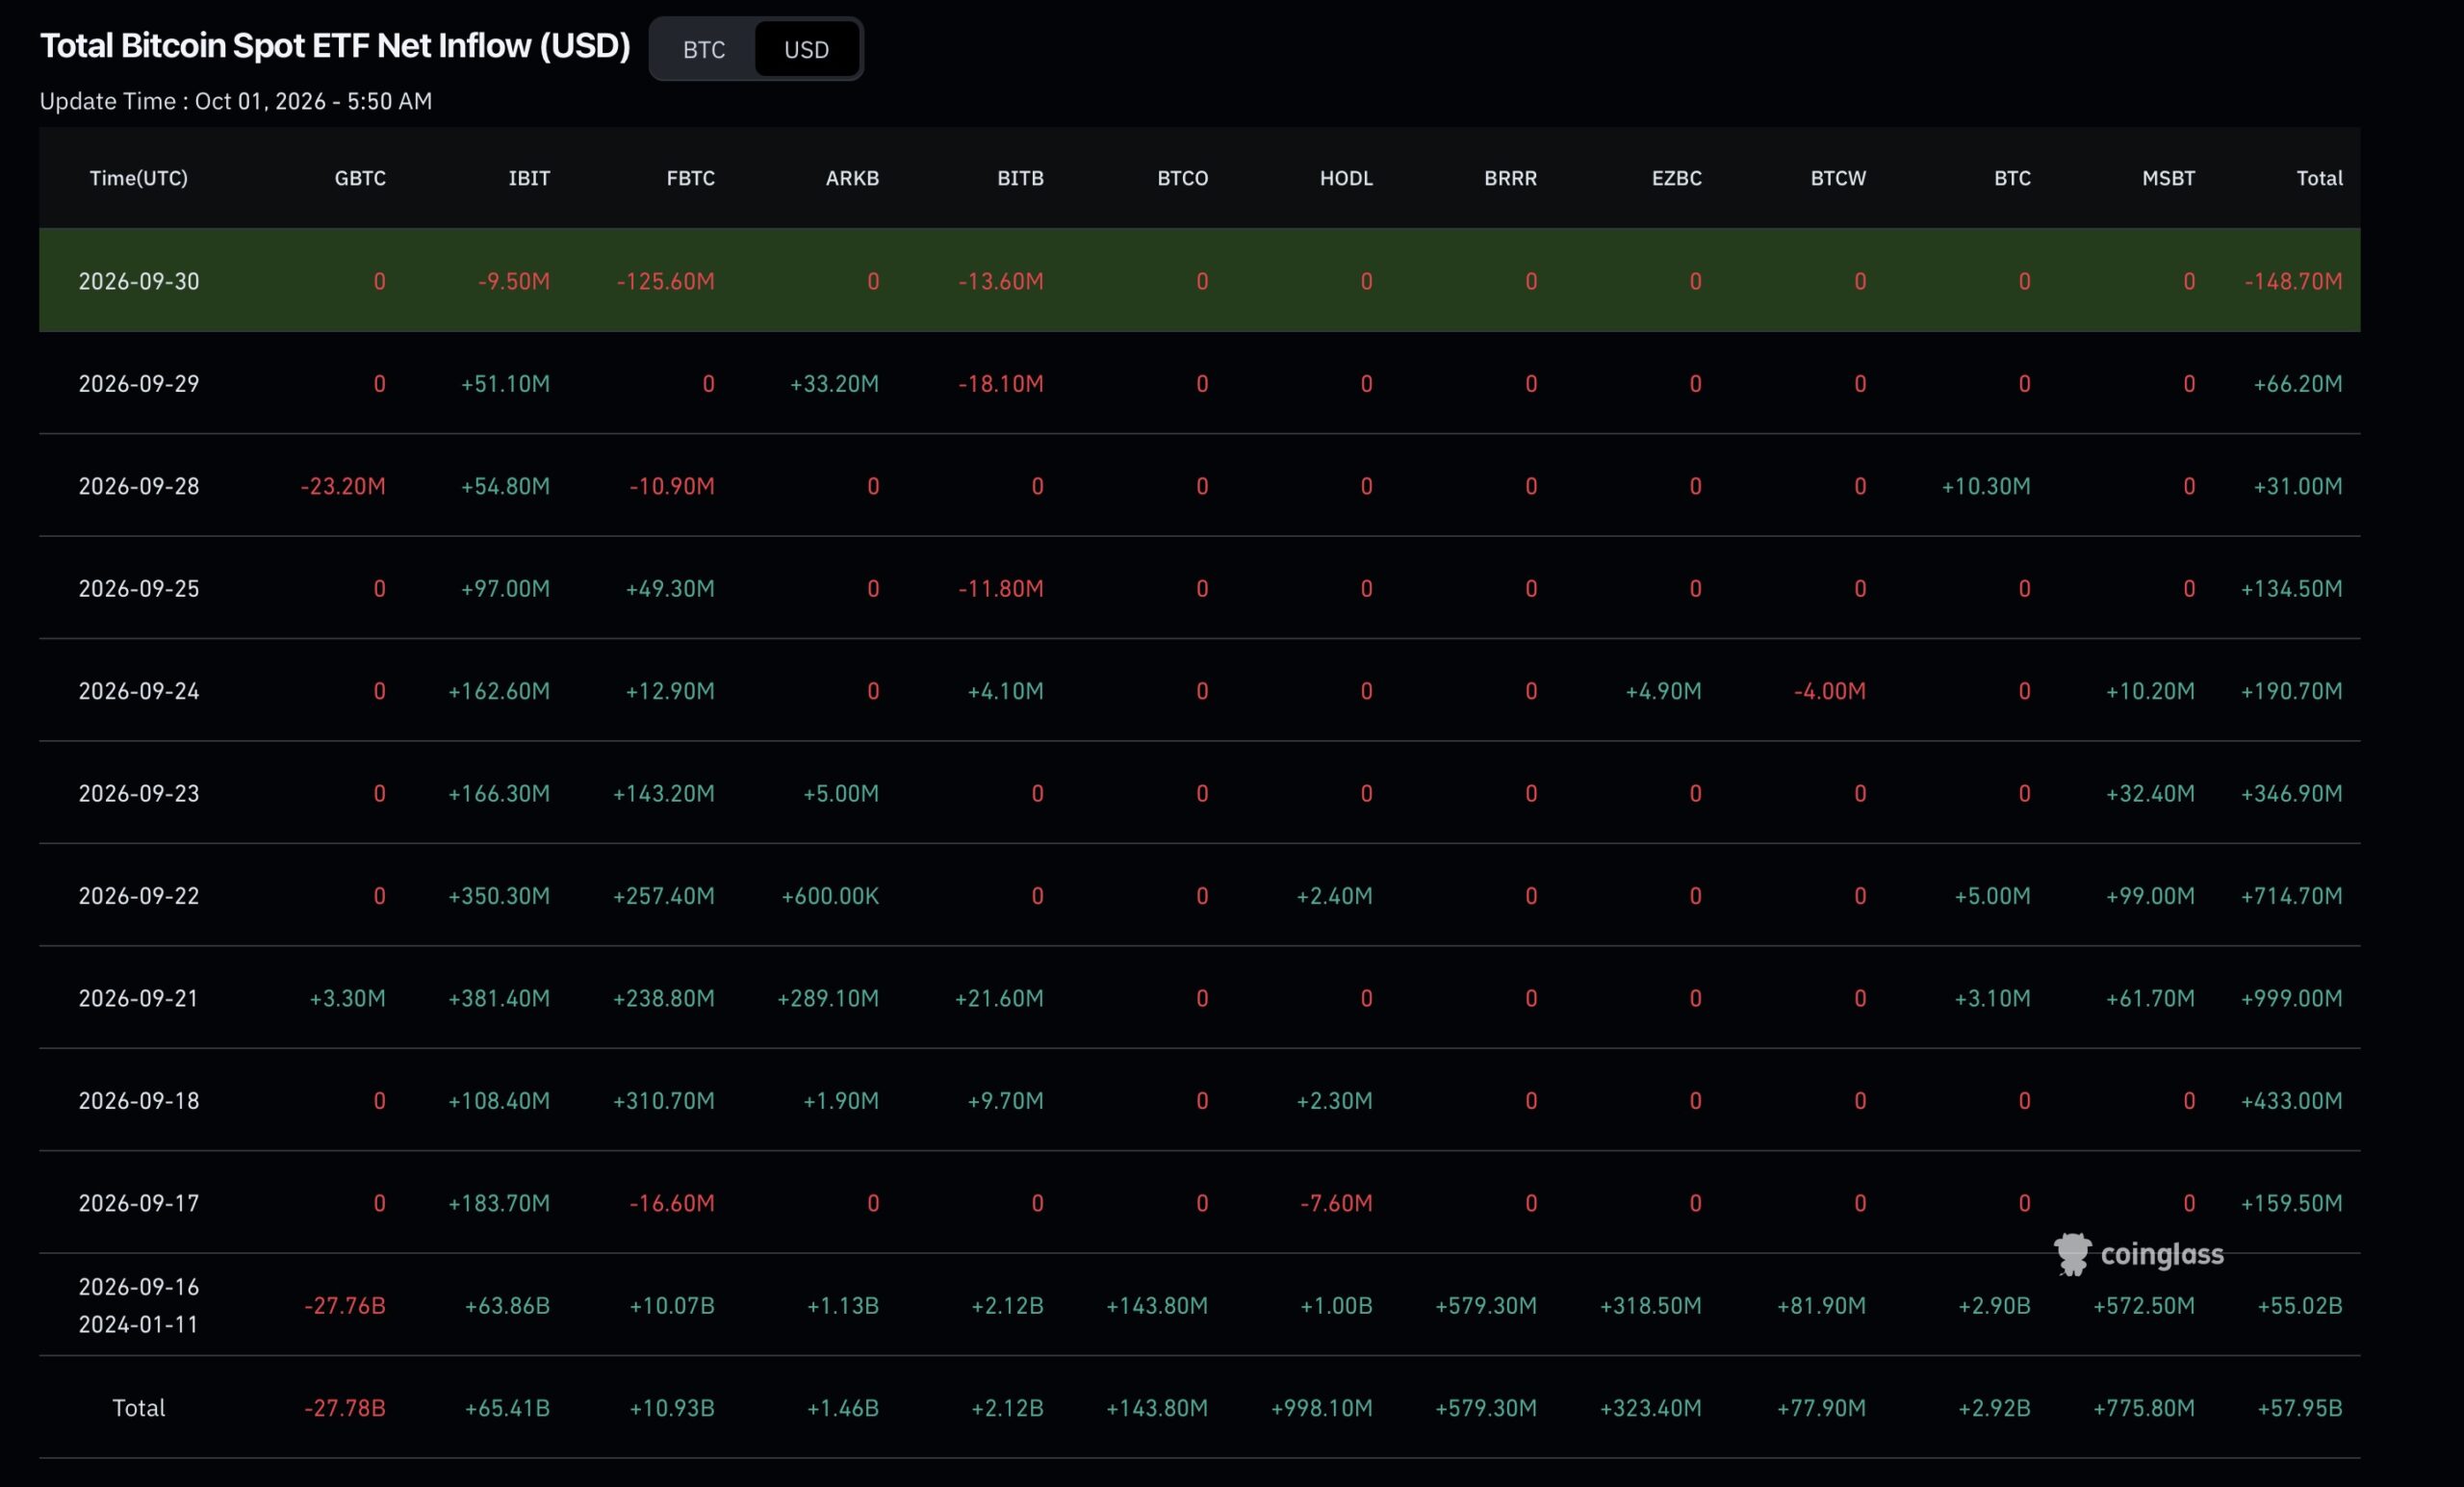
US spot Bitcoin ETFs saw a net outflow of $148.7 million on September 30, led by $125.6 million from Fidelity’s FBTC. Daily inflows have declined: $999 million on September 21, then $346.9 million, $190.7 million, and $134.5 million. Momentum weakened ahead of the outflow. Seasonality indicates typical outcomes; flows indicate current conditions.
BTC ETF Flows Coinglass
Technical Structure and Key Levels
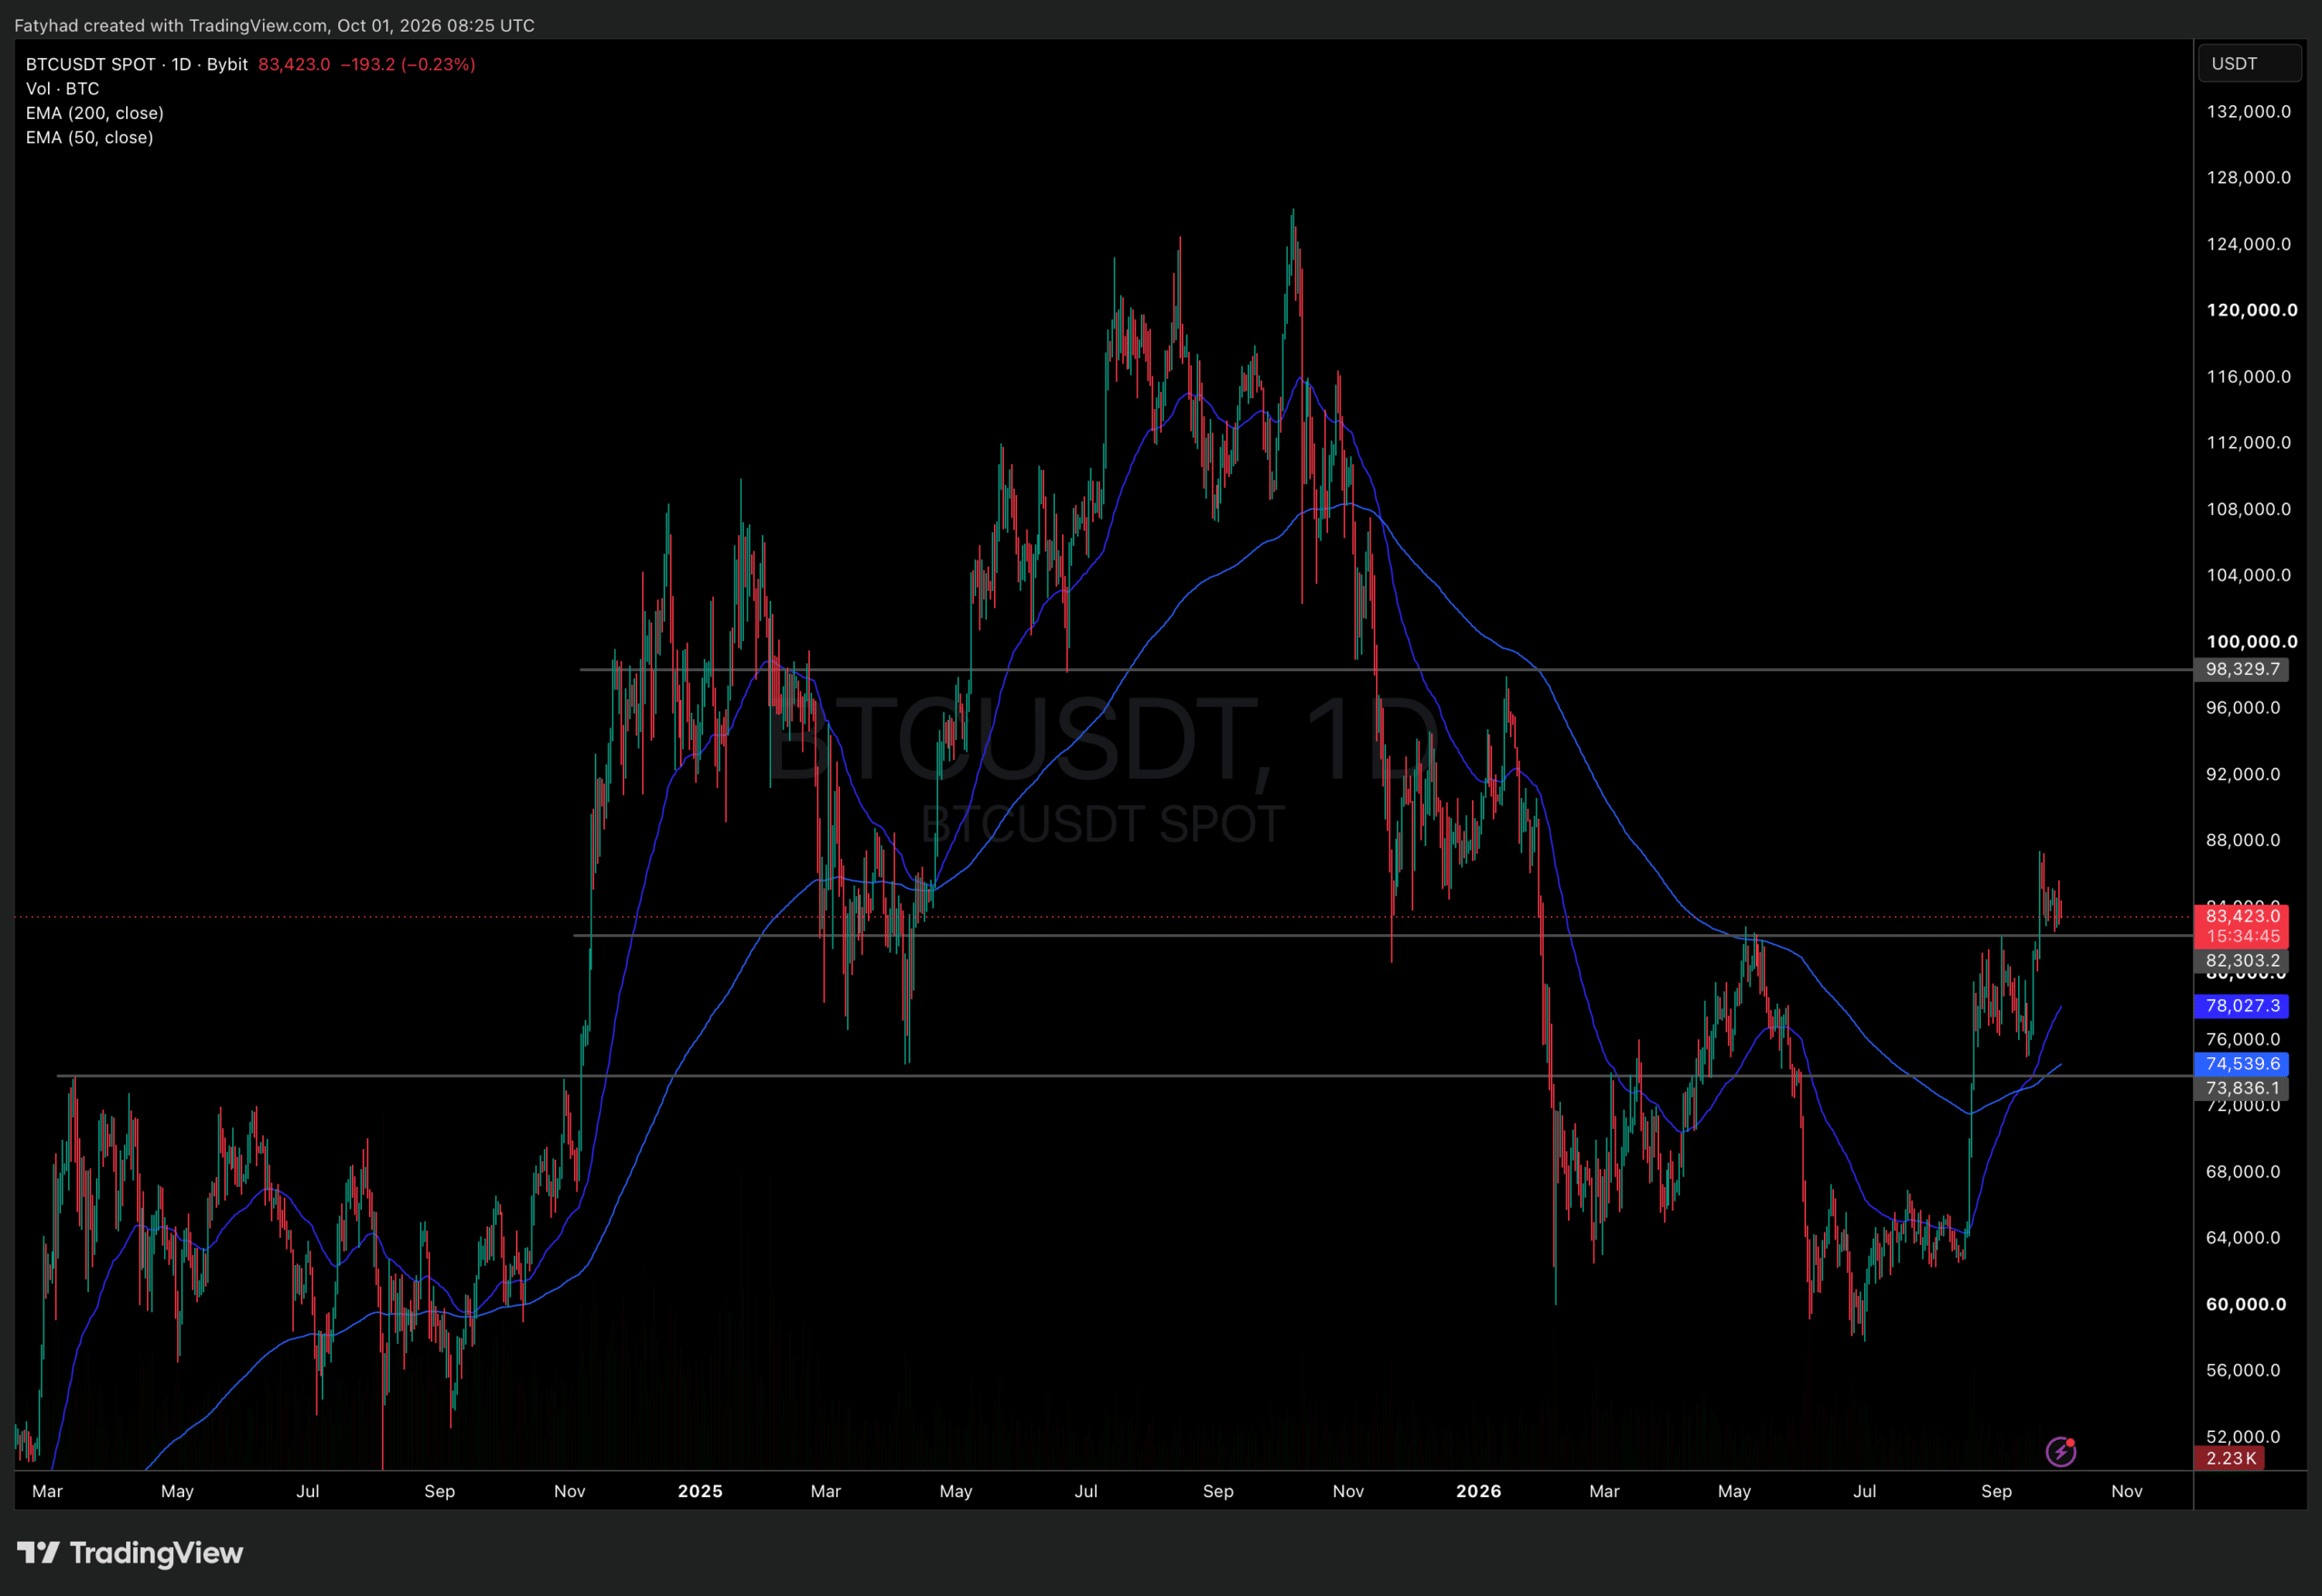
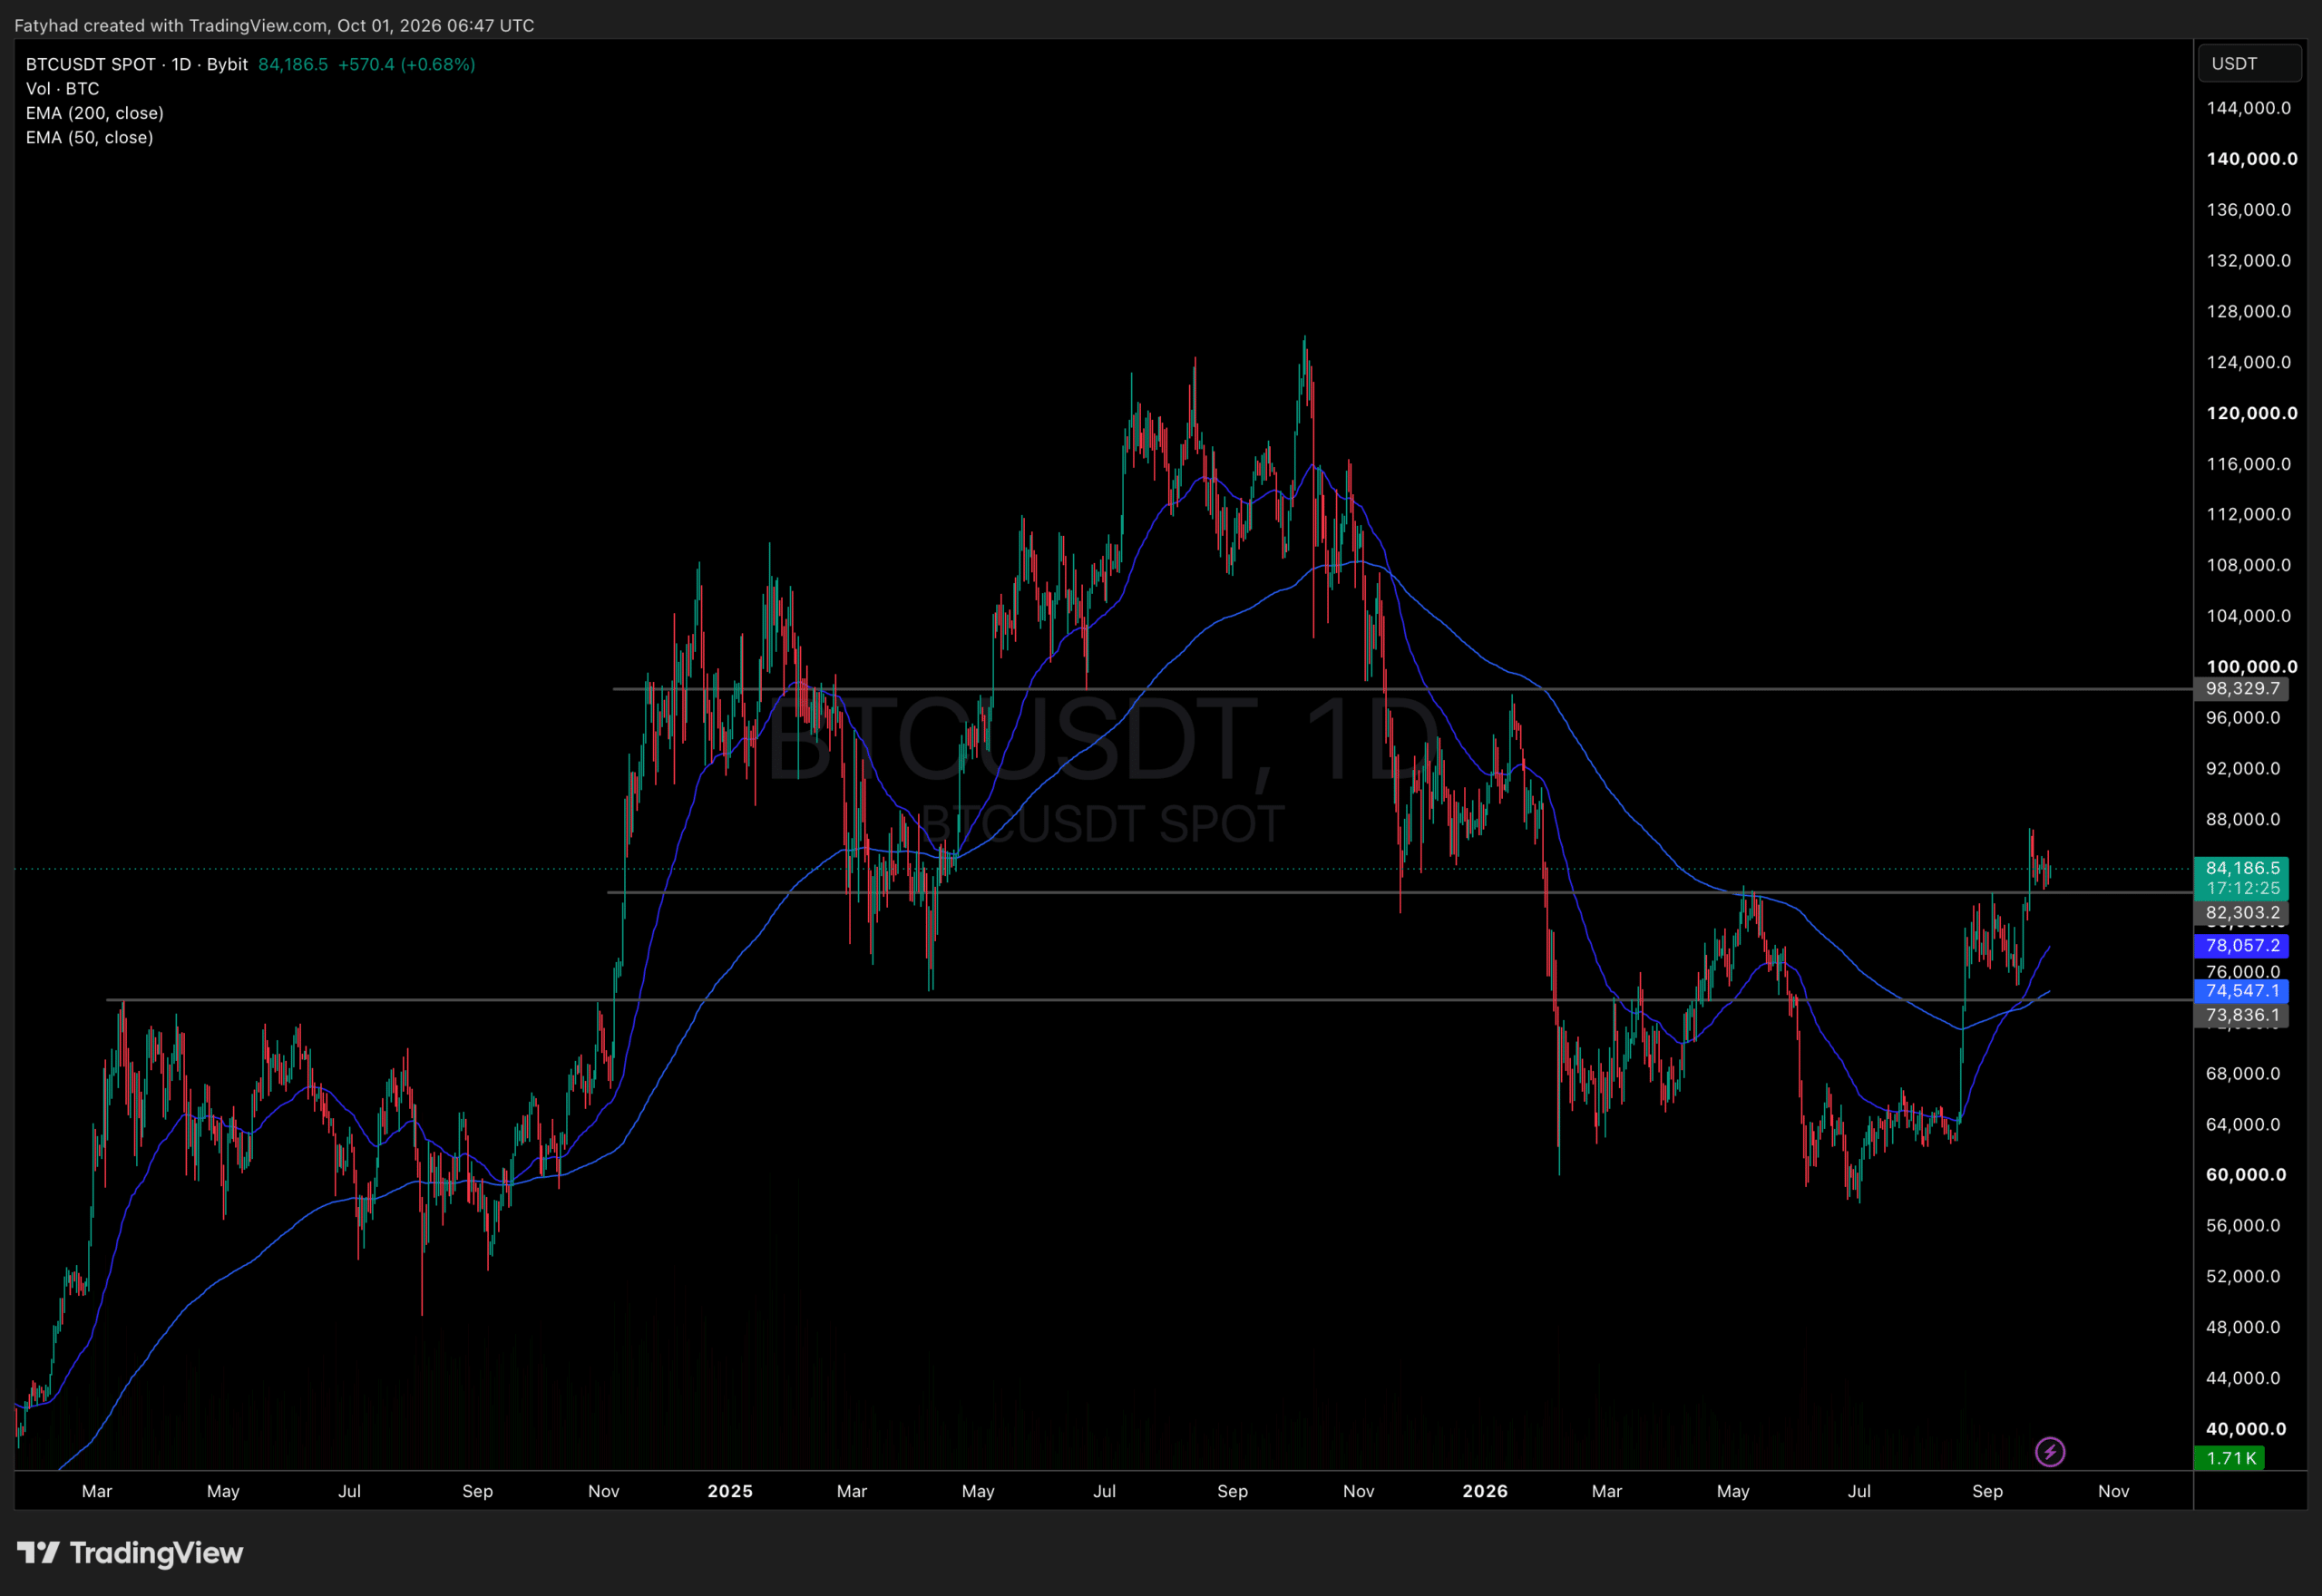
BTCUSDT Chart 1D TradingView
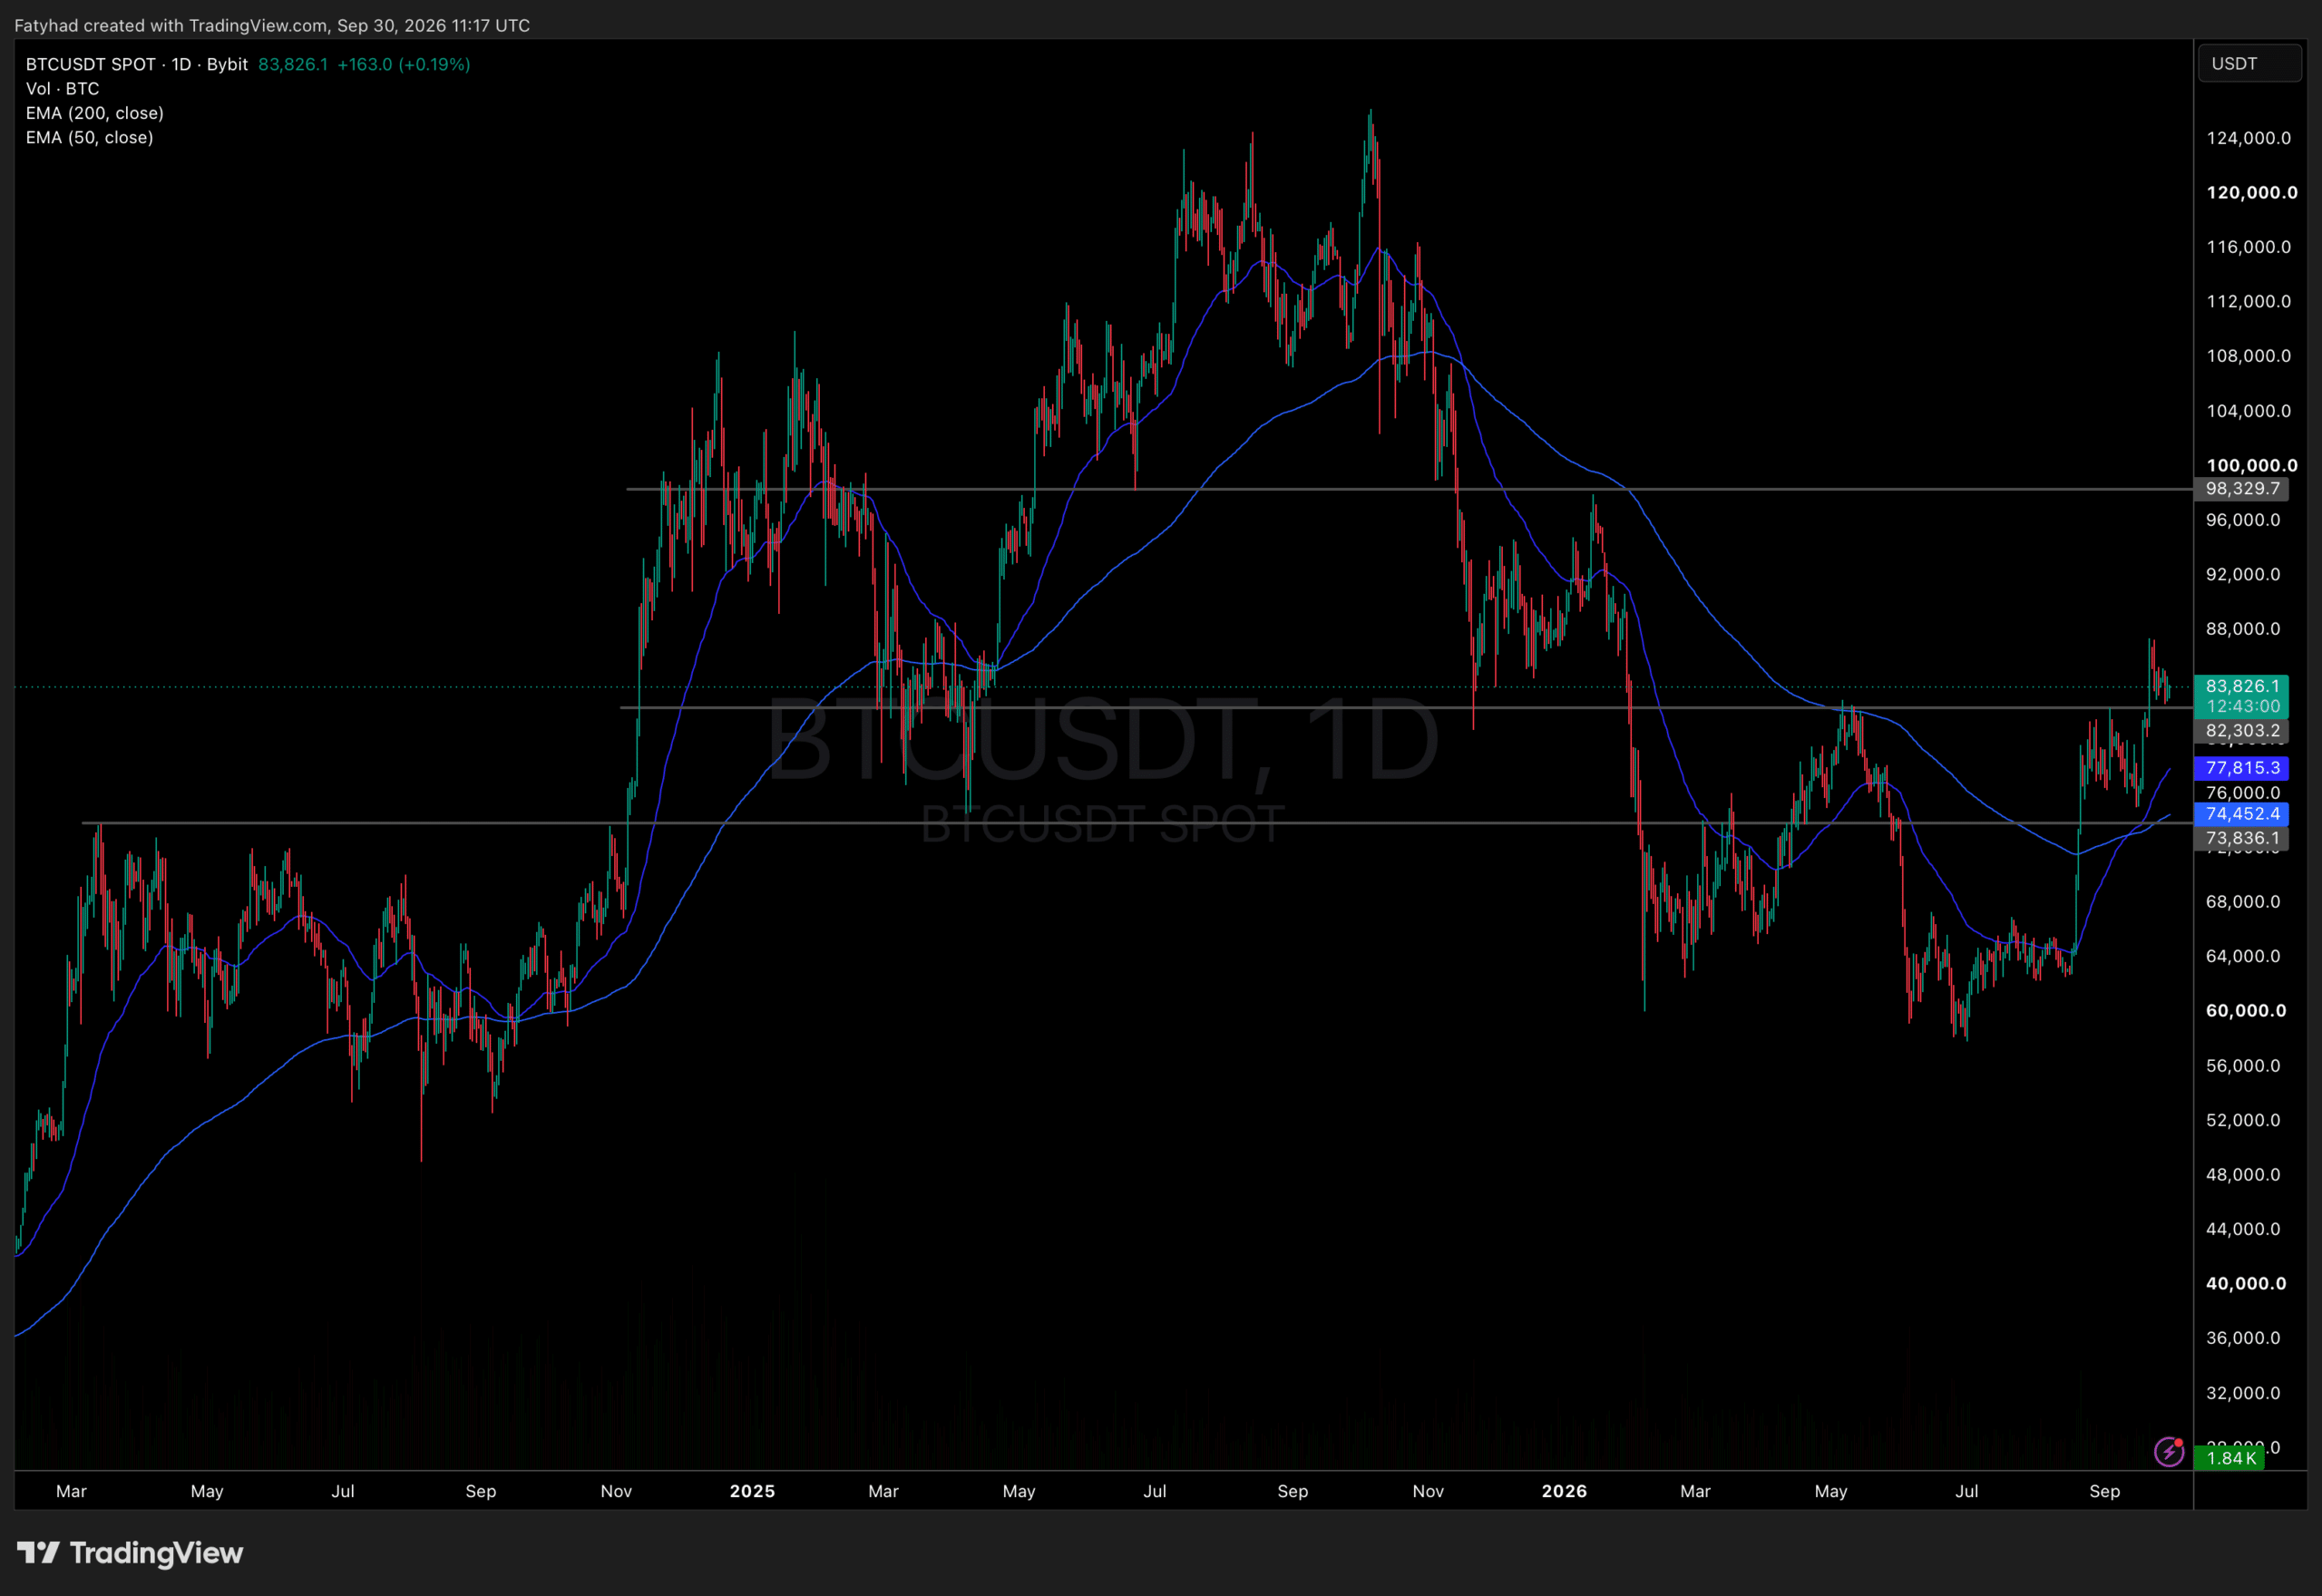
- Support to hold: $82,303. Daily closes above keep the quarterly breakout intact.
- Near-term supply: $88,000 to $90,000. Clearing this early would validate an October push.
- Upside target: $98,330, the last barrier before $100,000 and consistent with a median-to-average October move.
- Downside backstops: $78,027 at the 50-day EMA, then $74,540 at the 200-day EMA, with $73,836 below.
A 12.73% median October move from $83,423 implies about $94,000. The 18.49% average implies near $99,000. Both align with current structure. Flat opening and ETF outflows reduce the probability of a strong seasonal start. Sustained outflows would weaken the seasonal case.
Focus: monitor ETF flow direction over the next sessions, then assess seasonality.
Market Intelligence references removed.