Bitcoin liquidation map flags $71,800 short wall, squeeze may hit $75,000
Title: Binance map shows $71,800 short wall on BTC; squeeze to $75k needs real buyers
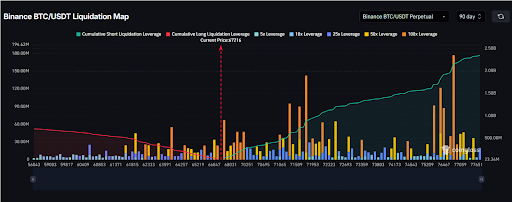
A Binance Bitcoin–USDT liquidation map flags a dense short wall near $71,800. A sweep could trigger forced buy-backs up to ~$75,000, then spot demand must take over.
High‑leverage clusters sit just above price, per Sherlock on X. Markets gravitate to these zones, where liquidations stack and amplify moves. More on the setup and next move here.
The key target is ~$71,800. NewsBTC highlights heavy 50x–100x shorts clustered there. Vertical bars on $71k–$72k dominate the heatmap. A push into that band can spark a chain of short liquidations and propel price higher.
Above, the map thins. From $72k to $76k, bars get smaller and the cumulative curve flattens, per this analysis. Forced buying may carry the move to ~$75k, then momentum likely needs real bids.
“Not forced buying.” Sustaining a breakout beyond that range would require organic demand, with ETF flows a potential driver, as net inflows return.
Price has held above $70,000 in the past 24–48 hours, giving an early read on March. Spot accumulation signs are emerging, which could support a steadier climb, per this and this.
If buyers don’t step in after a $76k sweep, upward momentum can fade fast. One scenario from NewsBTC sees a quick slide back under $60,000.
- $71.8k holds the biggest short wall source
- $72k–$76k shows thinner liquidation fuel source
- Push to ~$75k may come from liquidations; further gains need spot demand source