12 0
Ethereum Price Struggles Below $2,000 Amid Ongoing Bearish Pressure
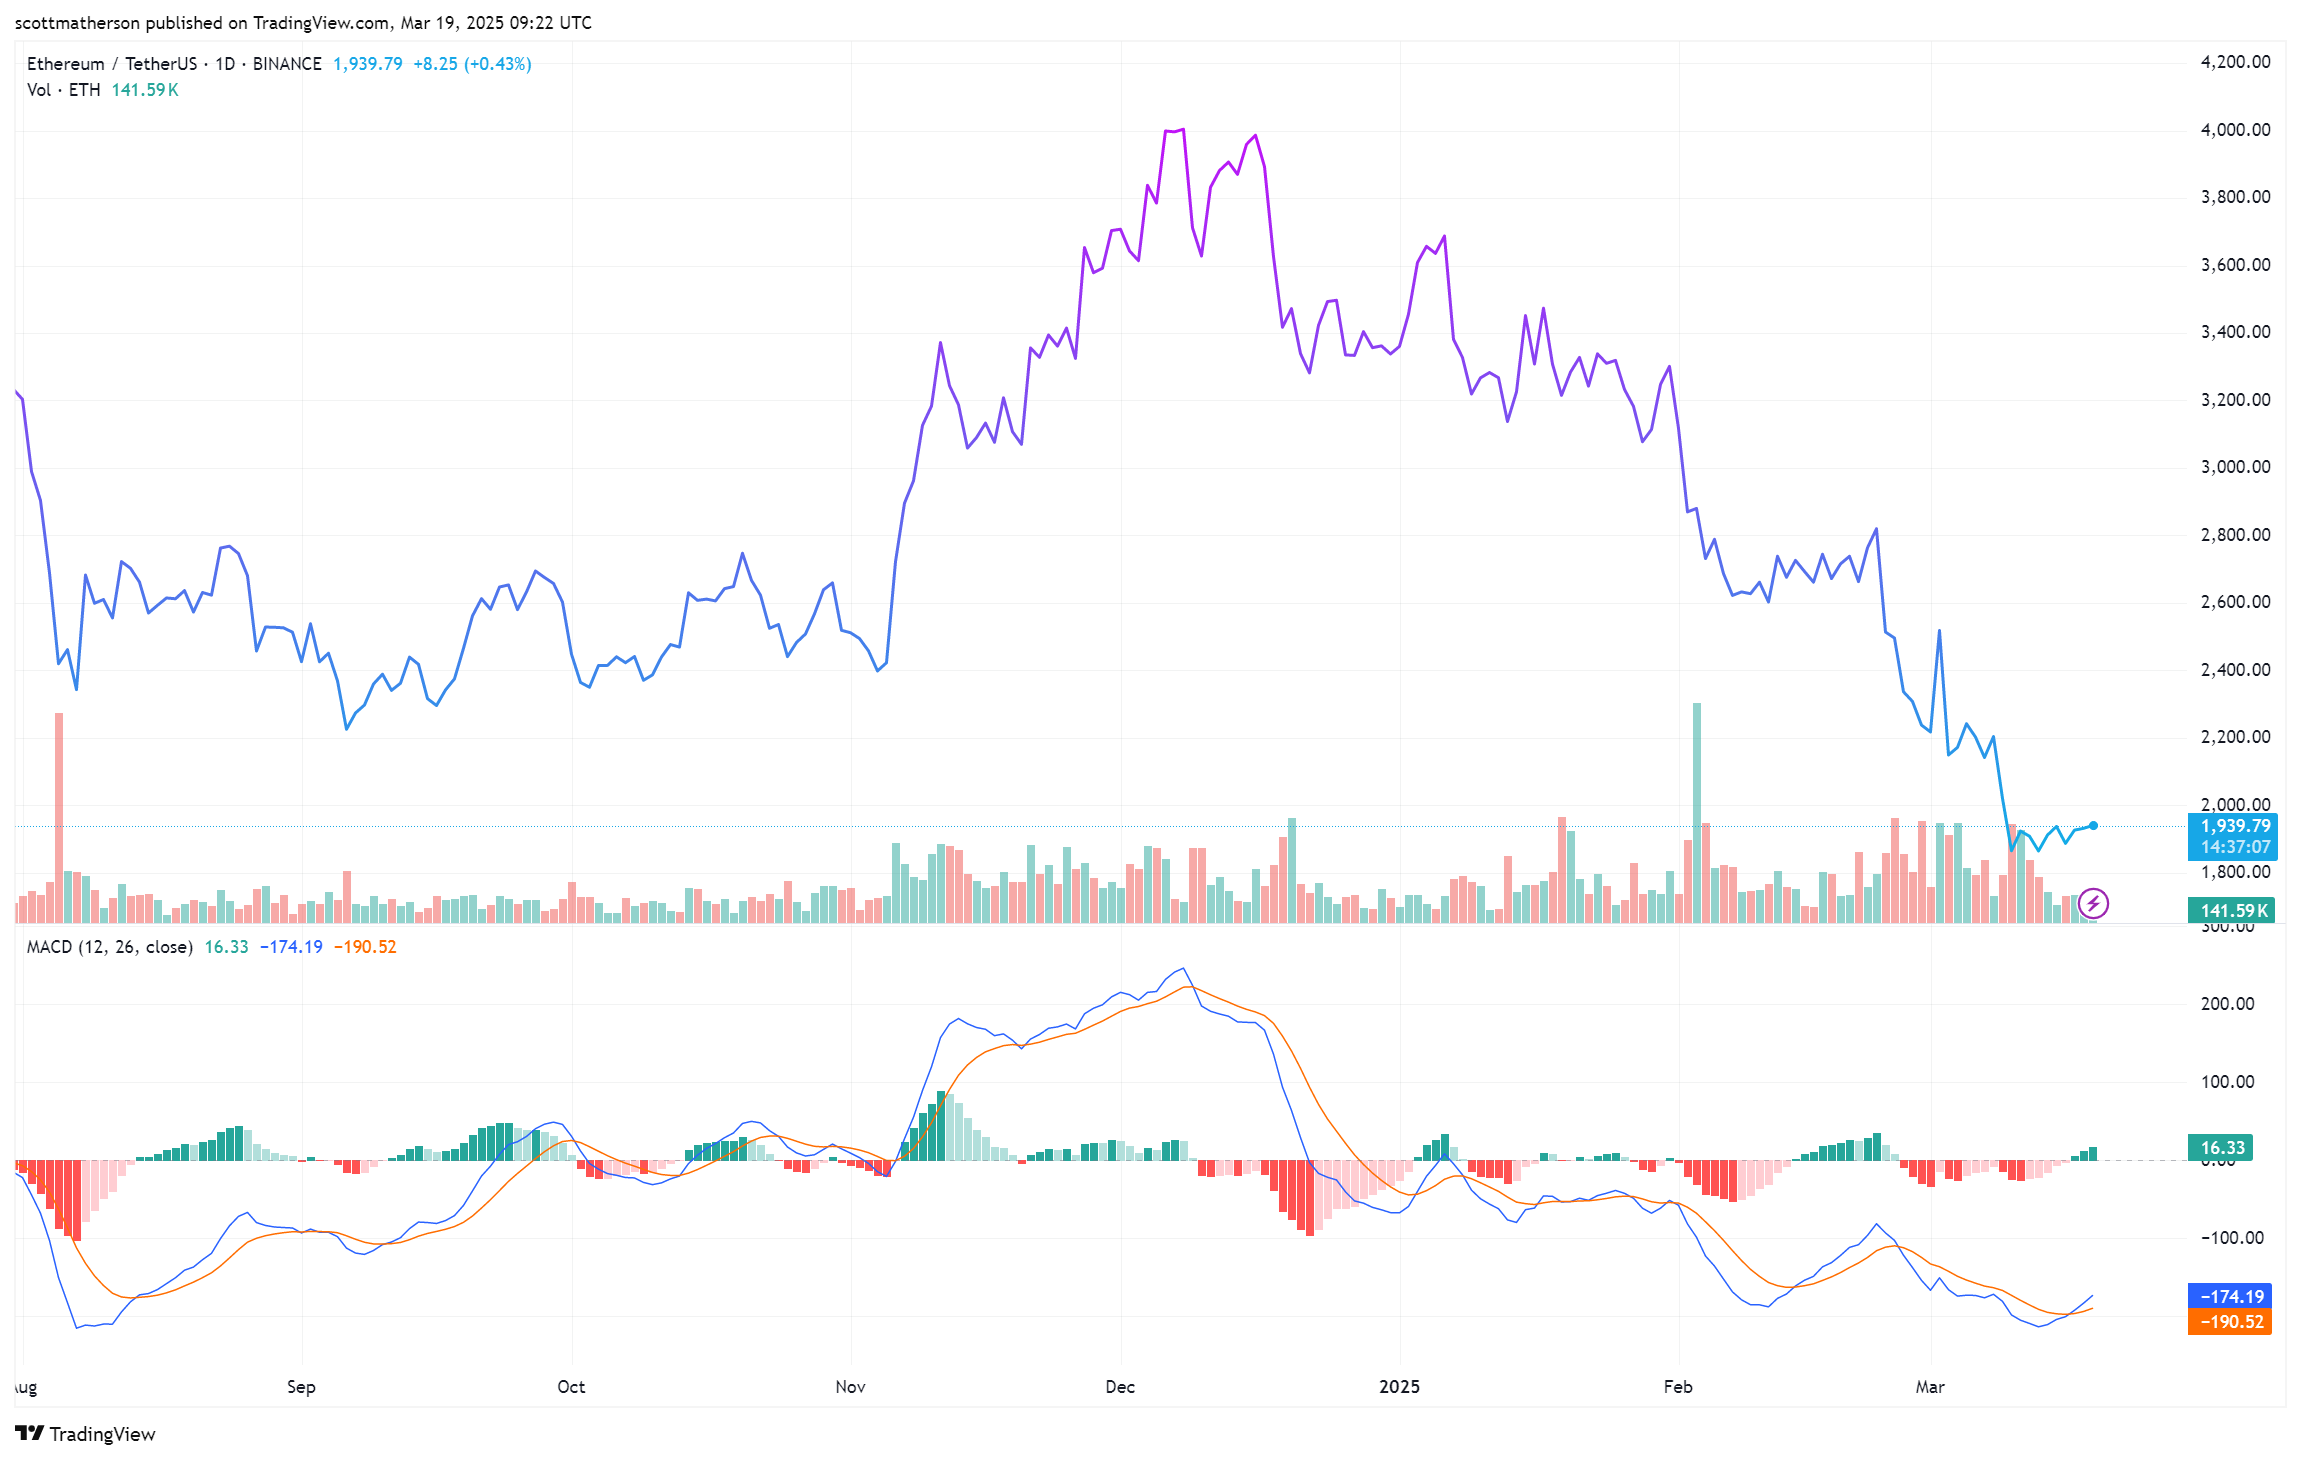
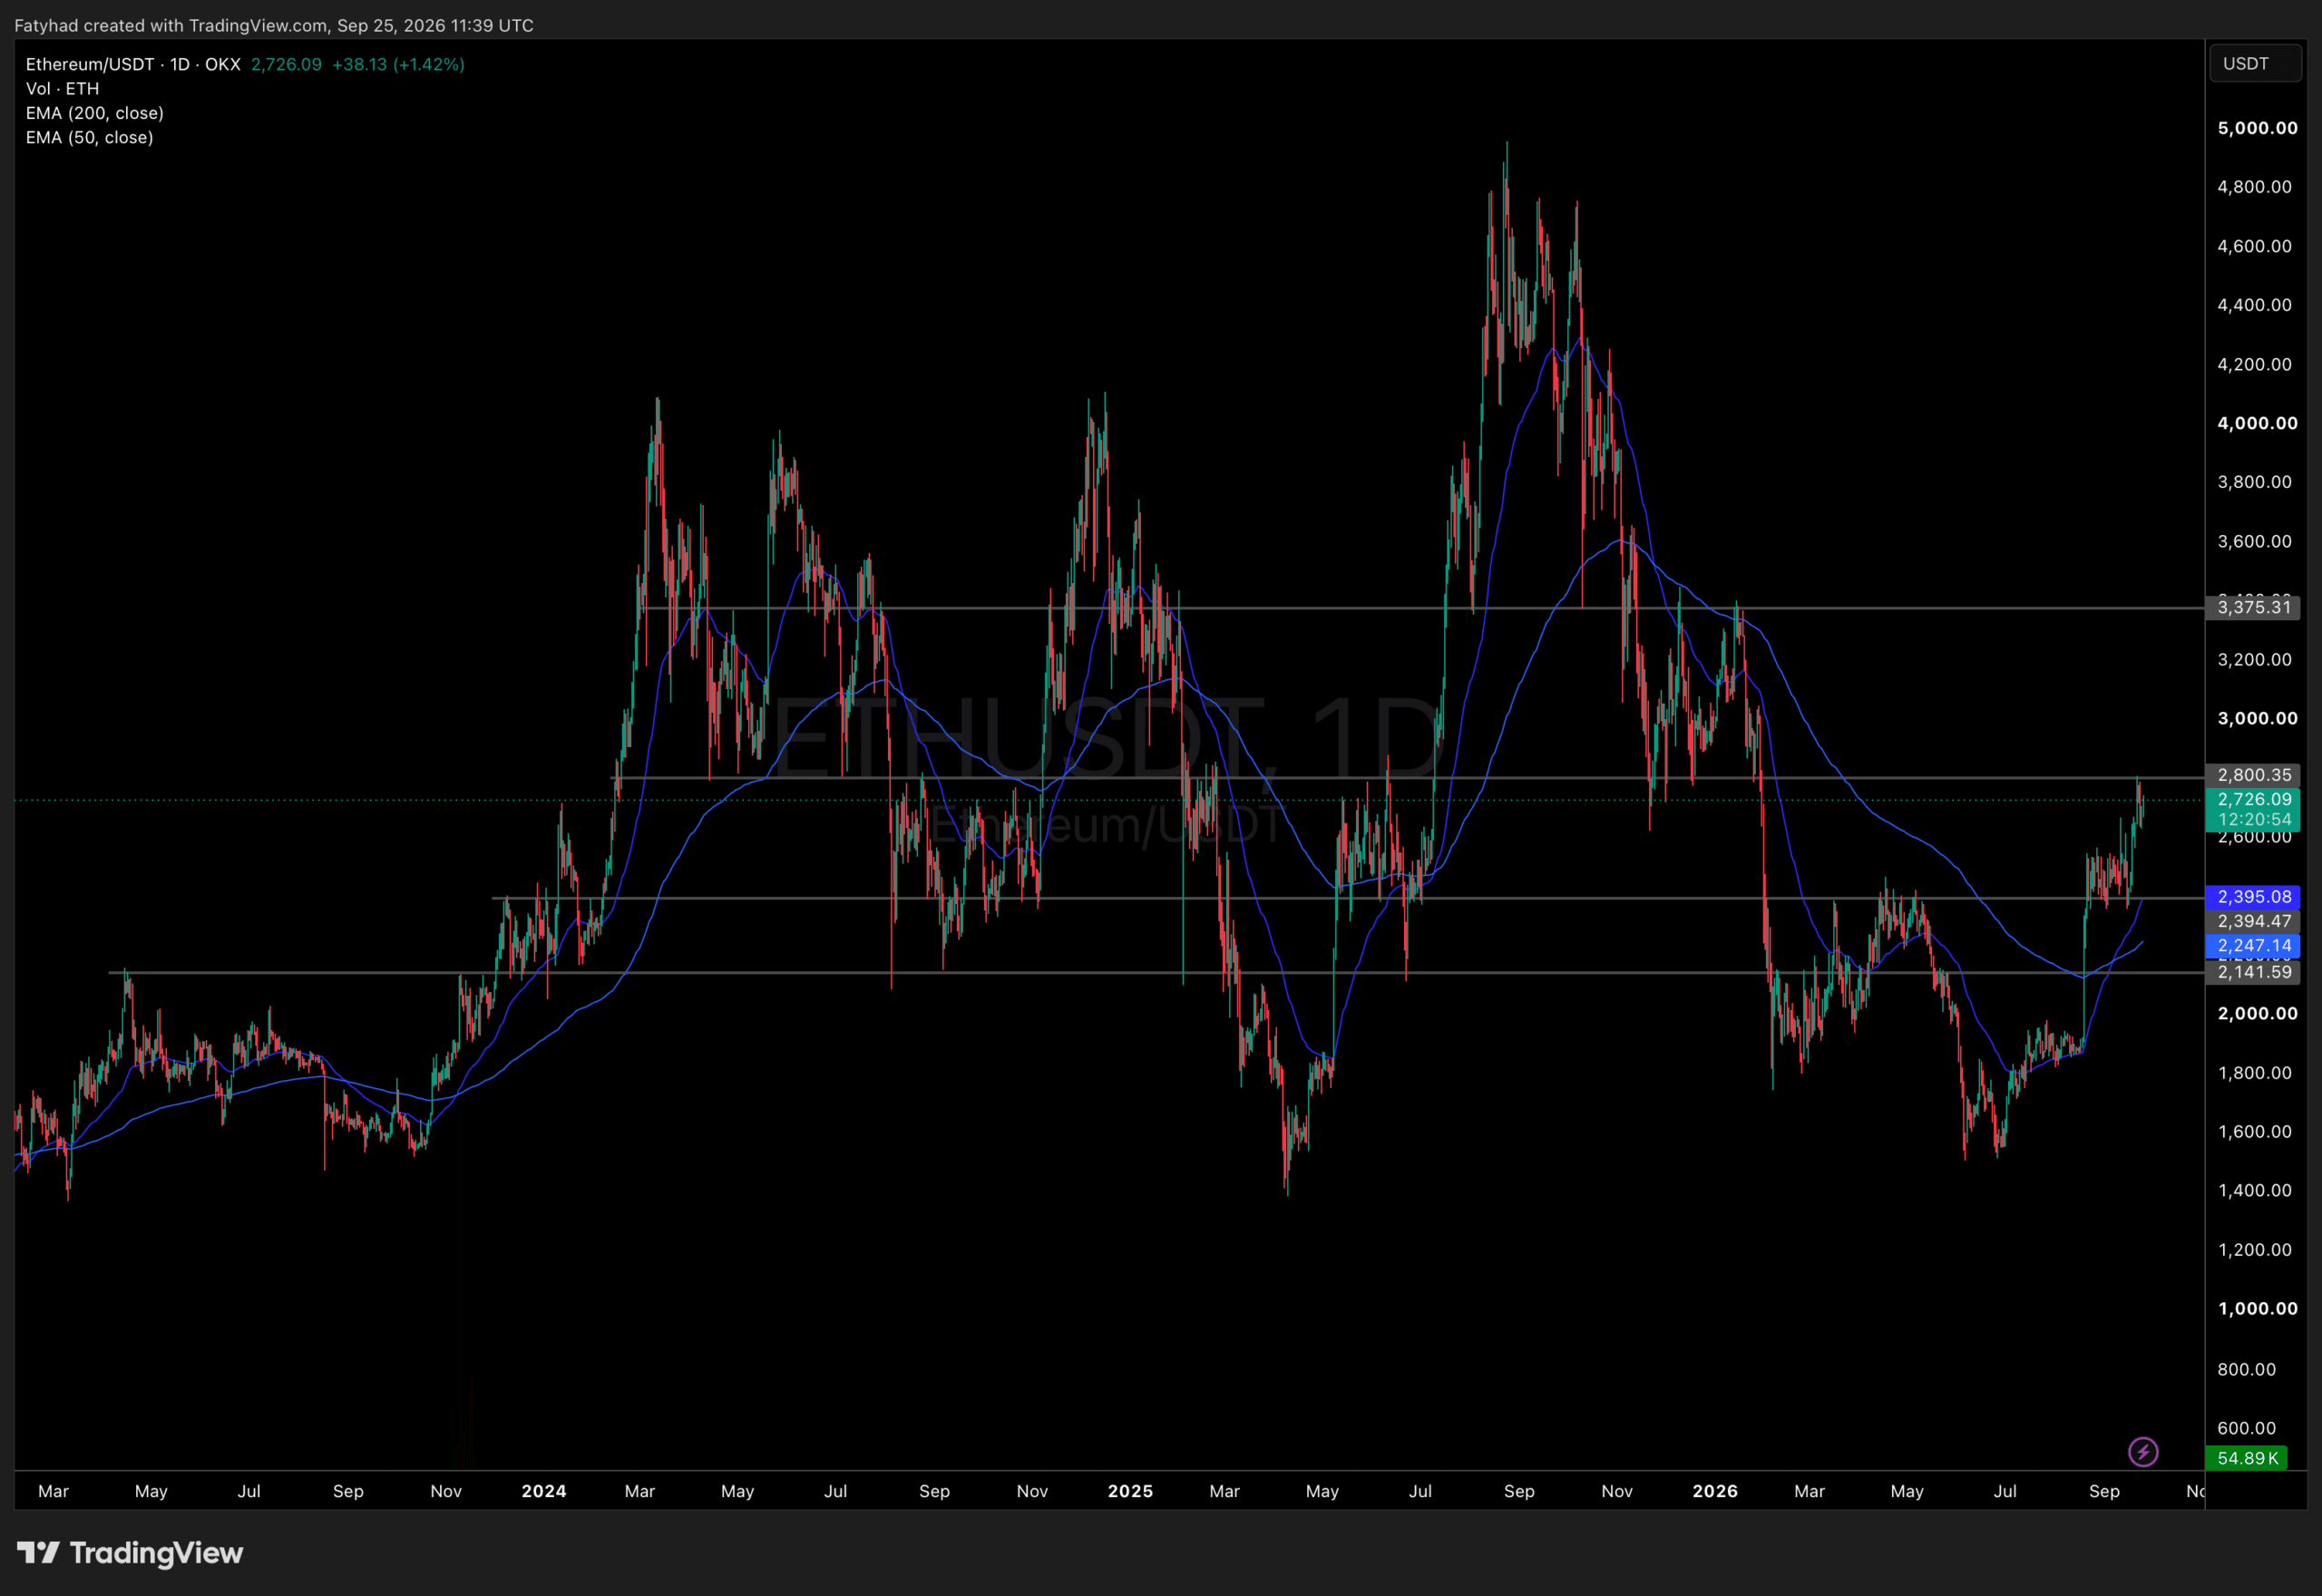
Ethereum is currently trading below $2,000 and shows little sign of recovery. The cryptocurrency has faced downward pressure since early March, with selling dominating the market.
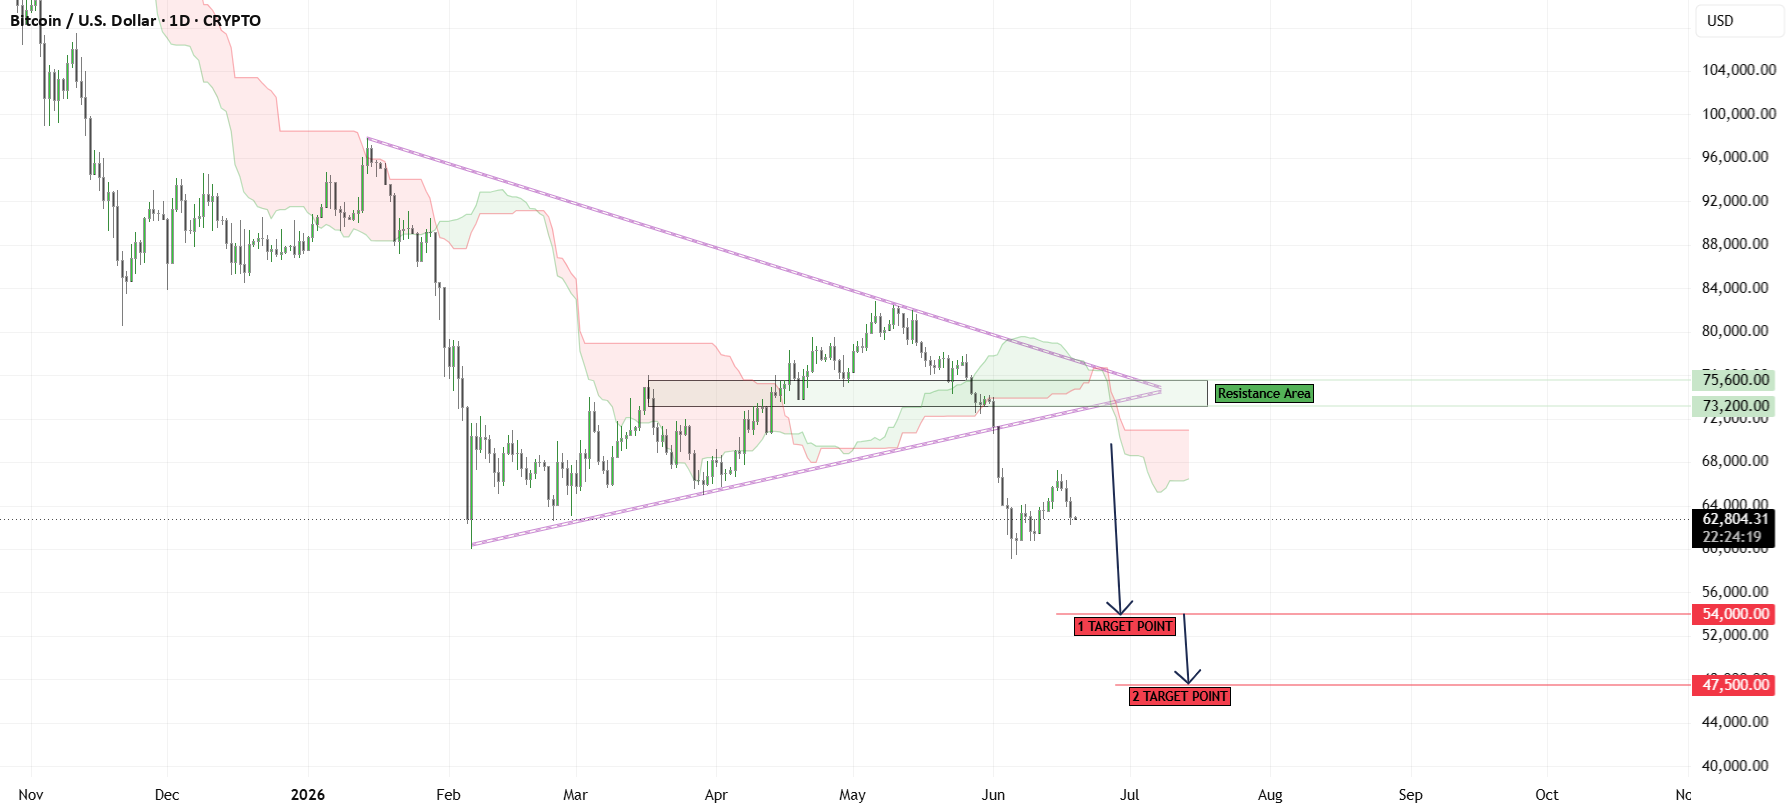
Technical Analysis Indicates Continued Bearish Trend
- Recent analysis using Elliott Wave theory suggests an ongoing bearish trend for Ethereum.
- An ABC correction pattern may dictate Ethereum's future movement.
- The analyst behdark notes recent pivot formations indicate a continuation of this correction.
ABC Correction Pattern Overview
This ABC correction has been unfolding since November 2021:
- Wave A: Initial decline.
- Wave B: Temporary retracement, nearing completion.
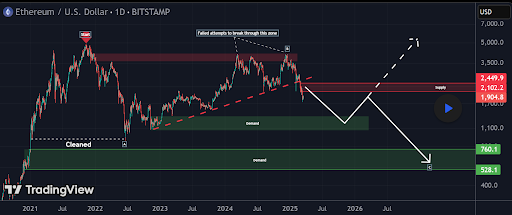
- Wave C: Expected to extend the current bearish trend, potentially leading to prices between $760 and $530.
Identified Demand Zones
- First demand zone: $1,350 to $1,080, where buying pressure might emerge.
- Second demand zone: $760 to $530, indicating a deeper correction if the first zone fails.
A significant resistance level exists at $2,941. Closing above this level would invalidate the bearish scenario. Currently, Ethereum trades at $1,930, with limited chances of breaking above $2,941 in the short term.