Solana slips below $88, tests $85 support amid downtrend
Solana slips under $88. Buyers defend $85 as trendline caps bounce.
Price lost $90 and $88 after failing above $92. Move mirrors Bitcoin and Ethereum weakness cited by NewsBTC (BTC analysis, ETH analysis).
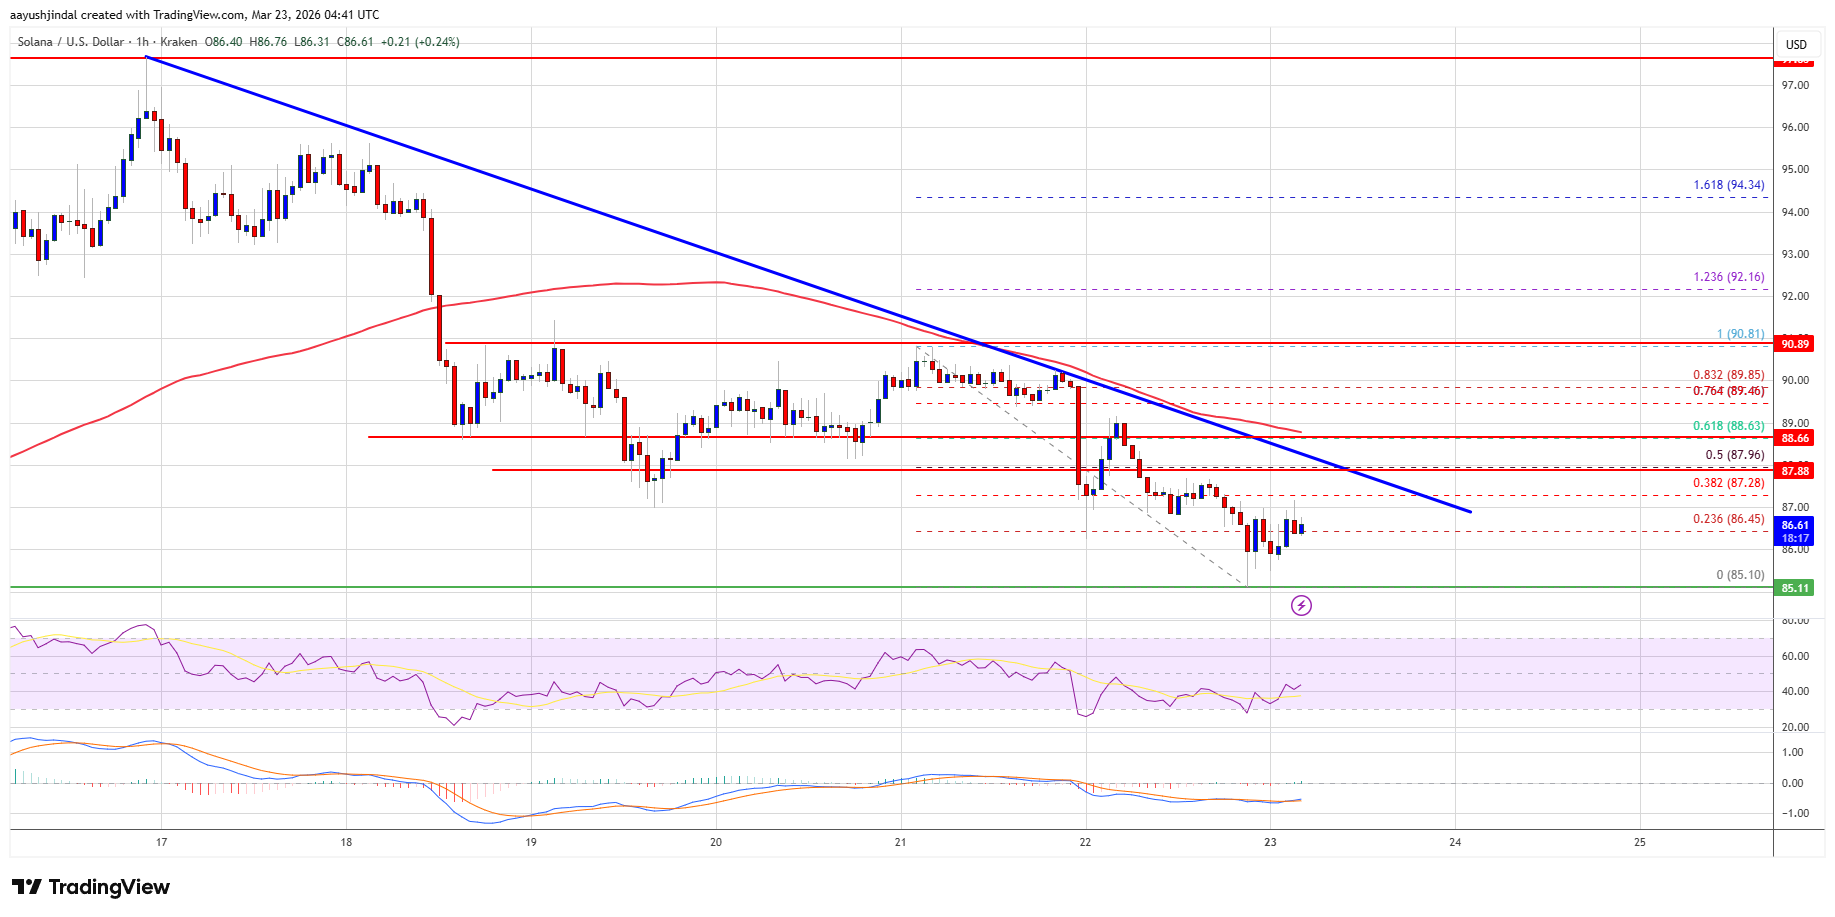
Swing high hit $90.81. Low printed at $85.10. Consolidation holds below the 23.6% Fib of that drop. Price trades below $88 and the 100‑hour SMA per the NewsBTC SOL hourly chart.
Immediate cap sits at $88 with a descending trendline. Next resistance is $88.60, the 61.8% Fib. A close above $90 opens $95, then $102, per the same chart.
MACD stays bearish on the hour. RSI sits below 50. Both shown on the chart.
- Coin: Solana (SOL)
- Range: $90.81 high to $85.10 low NewsBTC chart
- Resistance: $88 trendline, $88.60 Fib 61.8, $90, $95, $102 levels
- Support: $85, $82, $80, $74 levels
- Momentum: Hourly MACD bearish, RSI below 50 indicators
Authors credited by the source: Aayush Jindal
Published by Holder based on an external source.