Renko chart signals Bitcoin bullish breakout after double bottom at $60k–$65k
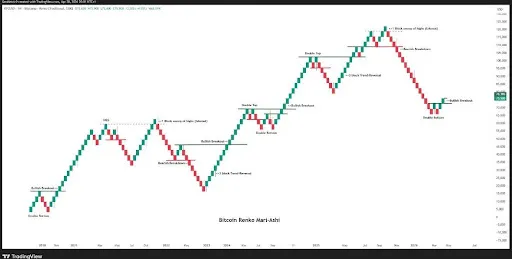
Renko Mari-Ashi chart signals a Double Bottom in Bitcoin (BTC), with a breakout zone in sight. The floor sits at $60,000–$65,000.
On April 28, analyst Geometric posted the setup on X, calling “another major bottom formation.” Source.
Renko Mari-Ashi tracks price only. It filters noise and prints bricks after fixed moves, not time. Method explained.
The chart maps BTC from 2018. It shows a second Double Bottom and a possible reversal. Pattern detail.
A similar Double Bottom appeared in September 2024. Weeks later, BTC ran toward $100,000. Run to $100k. Before that, a Double Top set the stage. Double Top.
BTC later printed an all-time high above $126,000 in October 2025. ATH $126k.
The current Double Bottom sits at $60,000–$65,000. First bottom hit in February 2026 near $60,000. February low. The second formed near $65,000 after a bullish fakeout. Chart view.
Geometric says the bear market may be over. He marks price back in green and a breakout zone. Bear market context Rally signal.
- Pattern: Double Bottom on Renko Mari-Ashi X post
- Levels: $60,000 and ~$65,000 floors Feb 2026 Chart
- Prior roadmap: Sep 2024 bottom, run to $100,000, ATH $126,000 in Oct 2025 $100k $126k
- Signal now: Breakout zone flagged, trend back to green Rally signal