Bitcoin ETFs record $681 million outflows as price holds $83,000
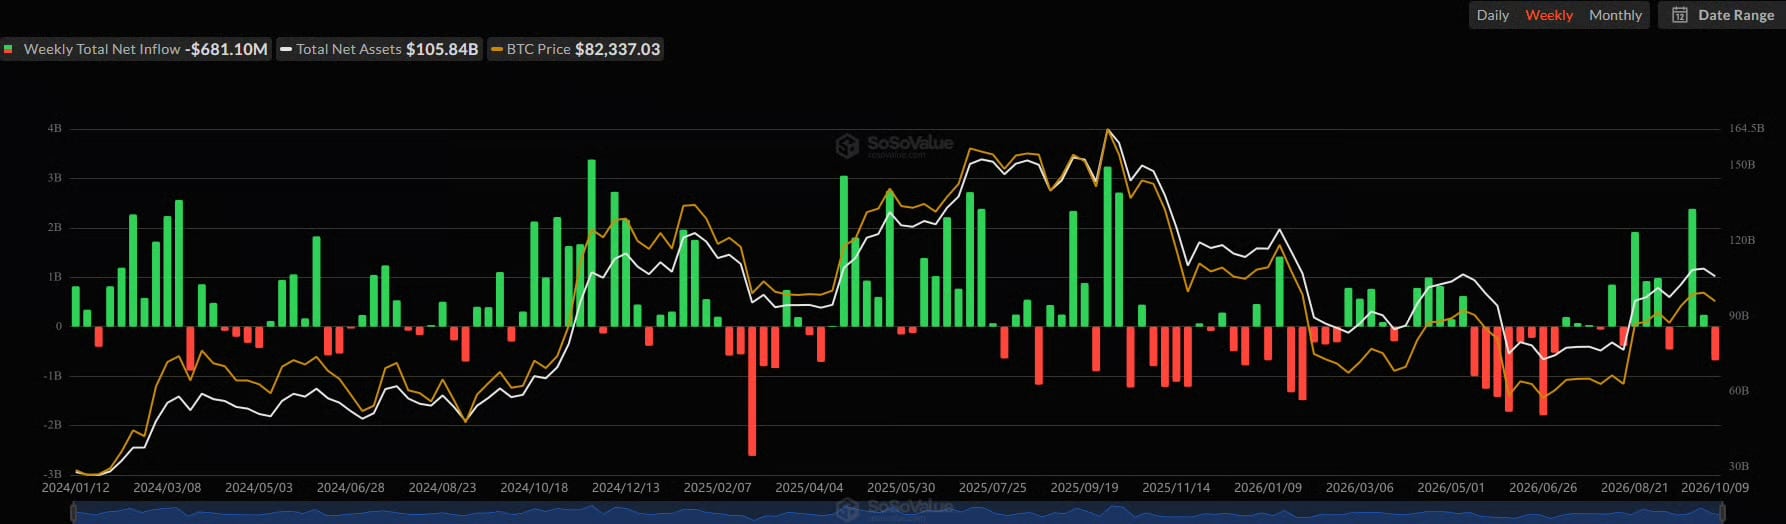
Spot Bitcoin ETFs recorded $681.10 million in weekly net outflows, the largest in three months. The weekly total was driven by two midweek sessions rather than a continuous trend. Bitcoin price action absorbed the selling: BTC fell from a Monday rejection at $87,000 to a Thursday low at $80,400, then recovered to close the week above $83,000. BTC trades near $83,790 with a market cap of $1.68 trillion, down 1.9% over seven days.
Bitcoin ETFs Flow sosovalue
Flow breakdown: concentrated midweek outflows
Weekly flows were uneven. Monday saw about $90 million of outflows. Tuesday posted $118.86 million of inflows. Wednesday and Thursday accounted for the entire weekly net outflow: $487.07 million and $244.13 million respectively. Friday ended with $21.13 million of inflows. The two midweek sessions totaled $731.20 million of redemptions, while the other three days combined for a net inflow of roughly $50 million. The pattern aligns with price’s rejection near $87,000 and the slide to $80,400.
Scale context: the last week of June saw $1.79 billion in outflows, more than double this week. Cumulative net inflows declined from $57.79 billion to $57.11 billion, a 1.2% reduction. Total net assets remain $105.84 billion.
Ethereum funds: persistent red streak
ETH ETFs posted five consecutive outflow days, extending a prior four-day streak with no green sessions since September 28. Daily outflows: $50.76 million, $201.89 million, $160.77 million, $72.54 million, and $56.10 million, totaling about $542 million. Cumulative net totals fell from $13.95 billion to $13.26 billion. On Friday, BlackRock’s IBIT took in $22.4 million while BlackRock’s ETHA lost $56.1 million. ETH trades near $2,553 after a midweek dip to around $2,400, down 5.2% over seven days versus BTC’s 1.9% decline. The data shows a divergence: Bitcoin funds found bids late in the week, Ethereum funds did not.
Market structure and on-chain signals
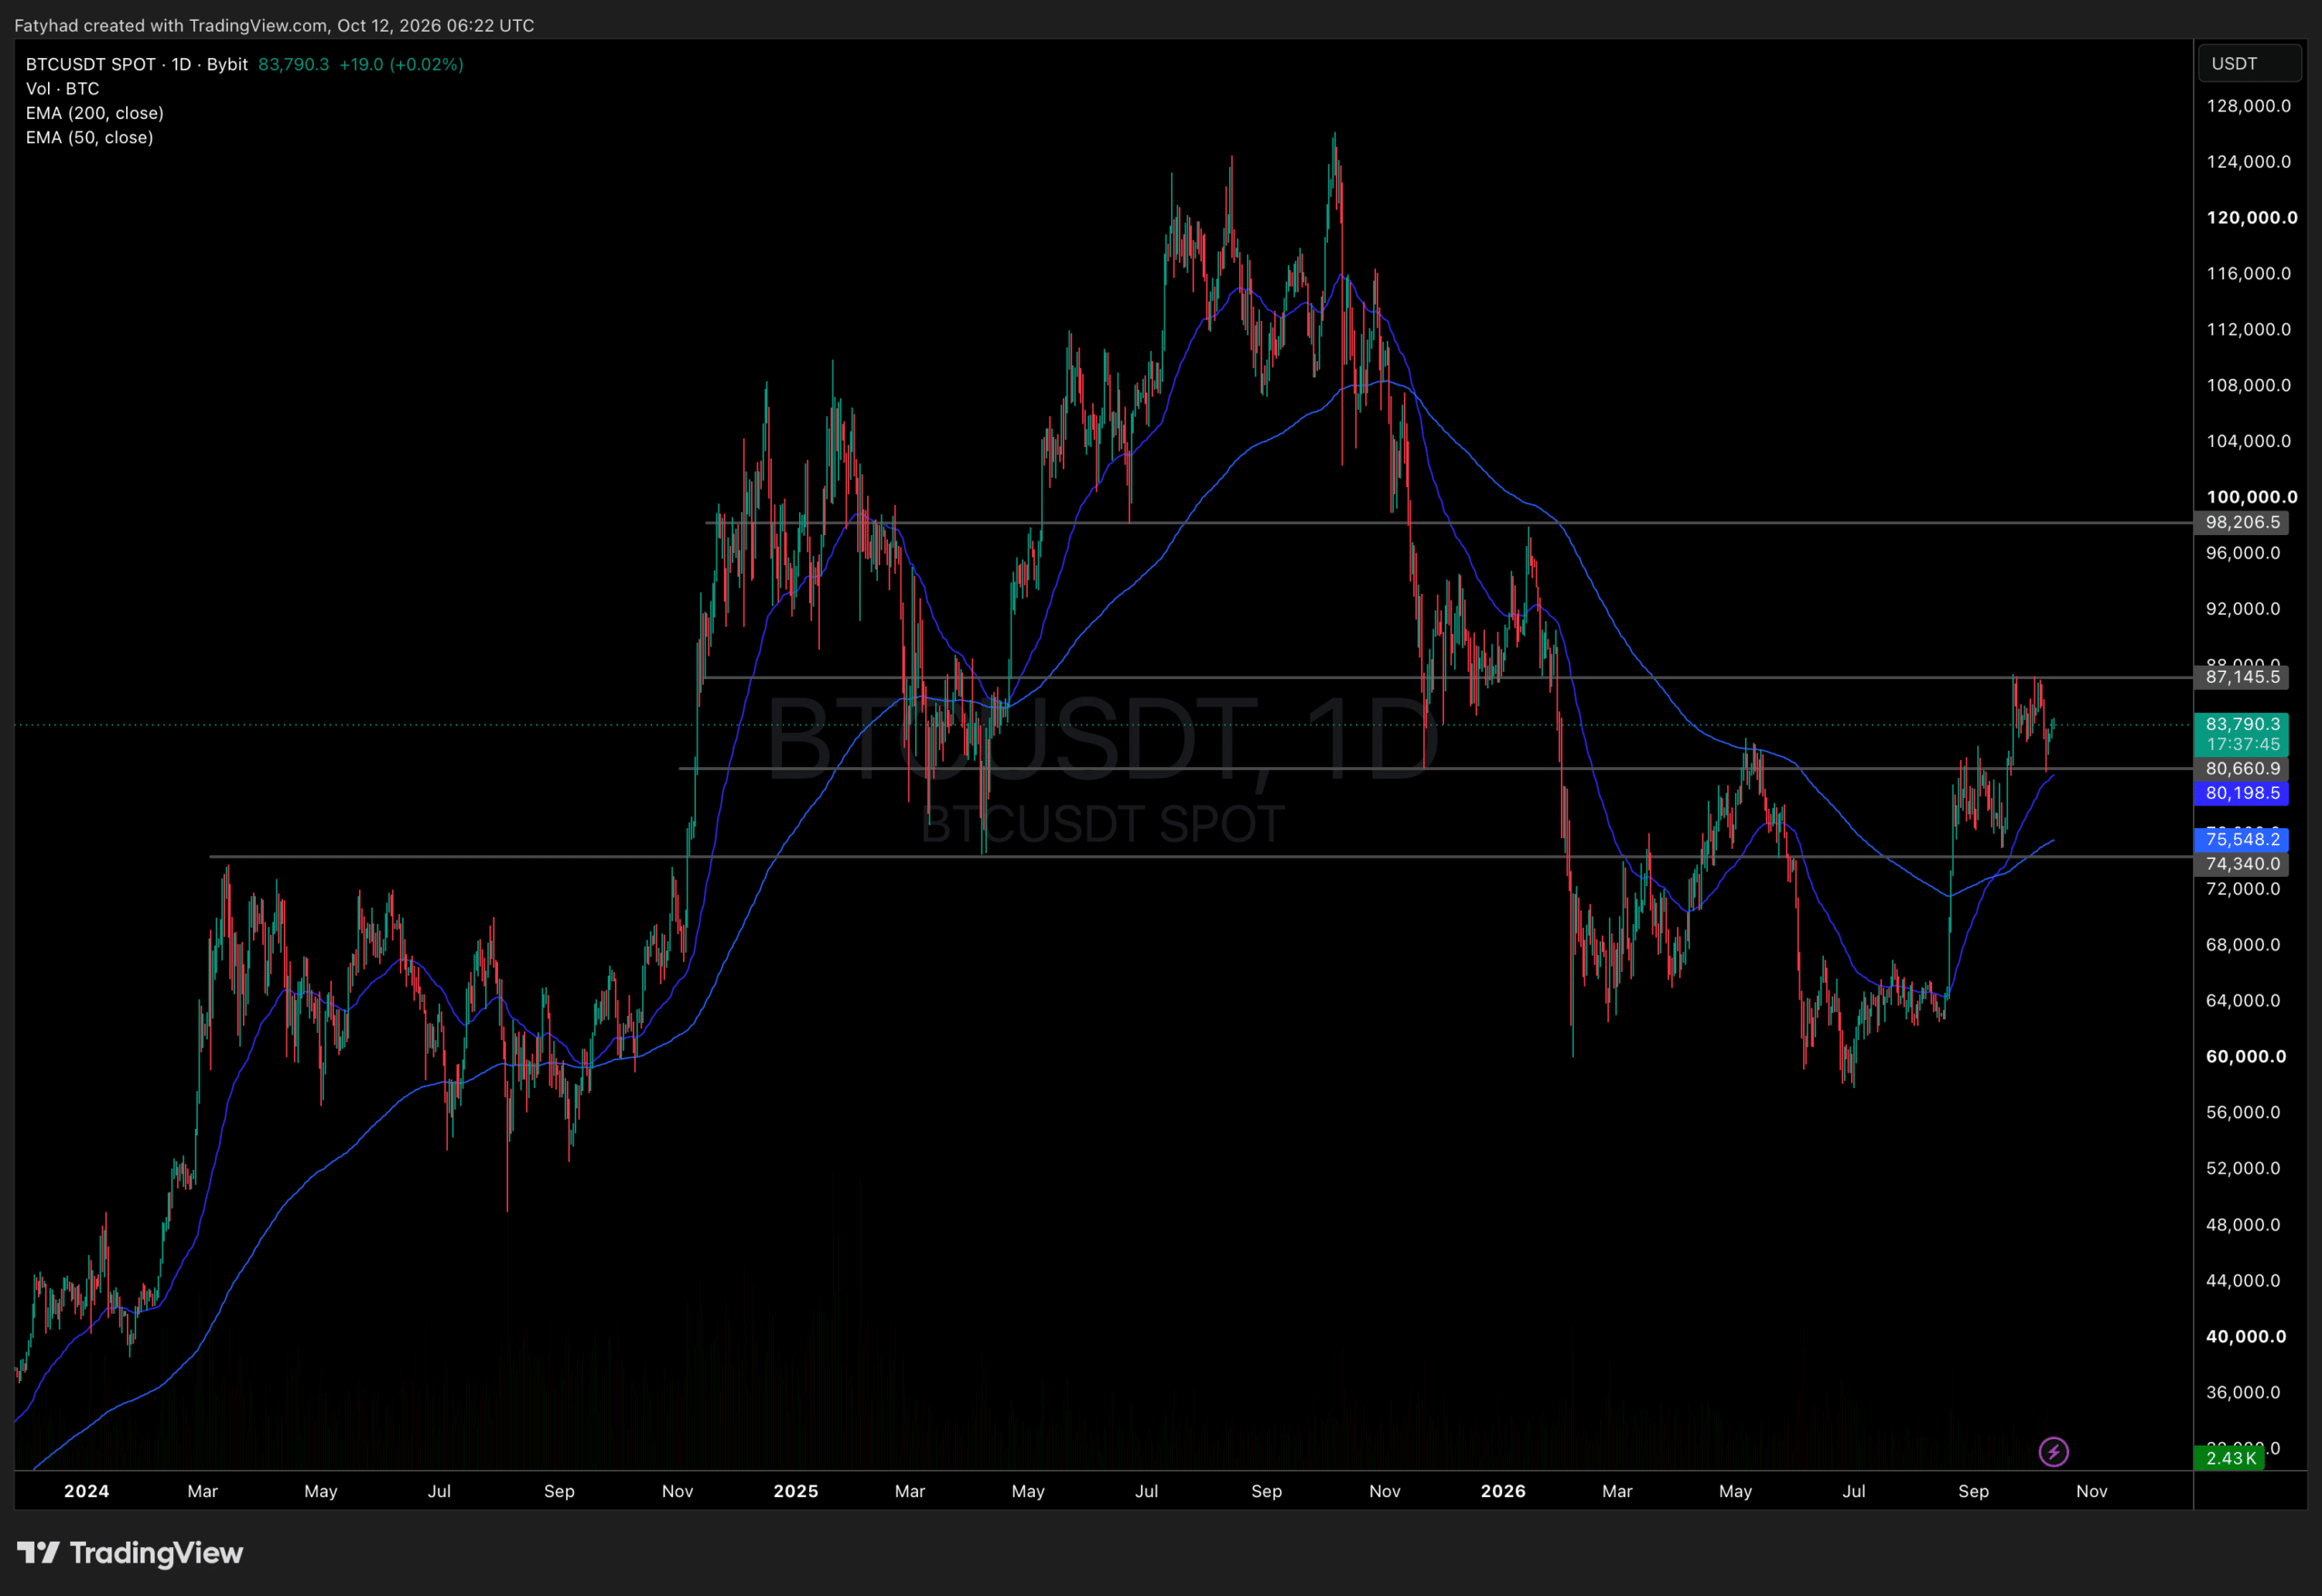
MVRV momentum turned positive according to Glassnode, with the ratio above its 365-day mean. Prior instances in 2019 and 2023 preceded extended advances. The MVRV ratio at 1.54 remains below its long-term mean near 1.8, indicating the metric is not extended by historical standards. Weekly closes above $83,000 keep bullish structure intact, with downside risk increasing if multiple weekly closes fall below that level and if a second consecutive heavy outflow week appears.
BTCUSDT Chart 1D TradingView
Key technical levels
- Floor: $80,660, defended during Thursday’s drop to $80,400. The 50-day EMA sits near $80,198.
- Structural line: $75,548 at the 200-day EMA. A break would negate the recovery structure.
- Ceiling: $87,145, rejected four times in two weeks. A break would end the sequence of lower highs.
Conclusion: the weekly outflow headline masks a two-day event. Bitcoin price resilience suggests no confirmed trend reversal. Ethereum flows and price underperformance show weaker demand relative to Bitcoin. Monitoring weekly closes around $83,000 and ETF flow persistence will clarify whether pressure remains episodic or becomes structural.
Authors credited by the source: Daniel Francis
Published by Holder based on an external source.