Ethereum fails to reclaim $1,700, slides below $1,665, targets $1,550 support
ETH slips below $1,680. Buyers hold $1,610. $1,710 blocks the bounce.
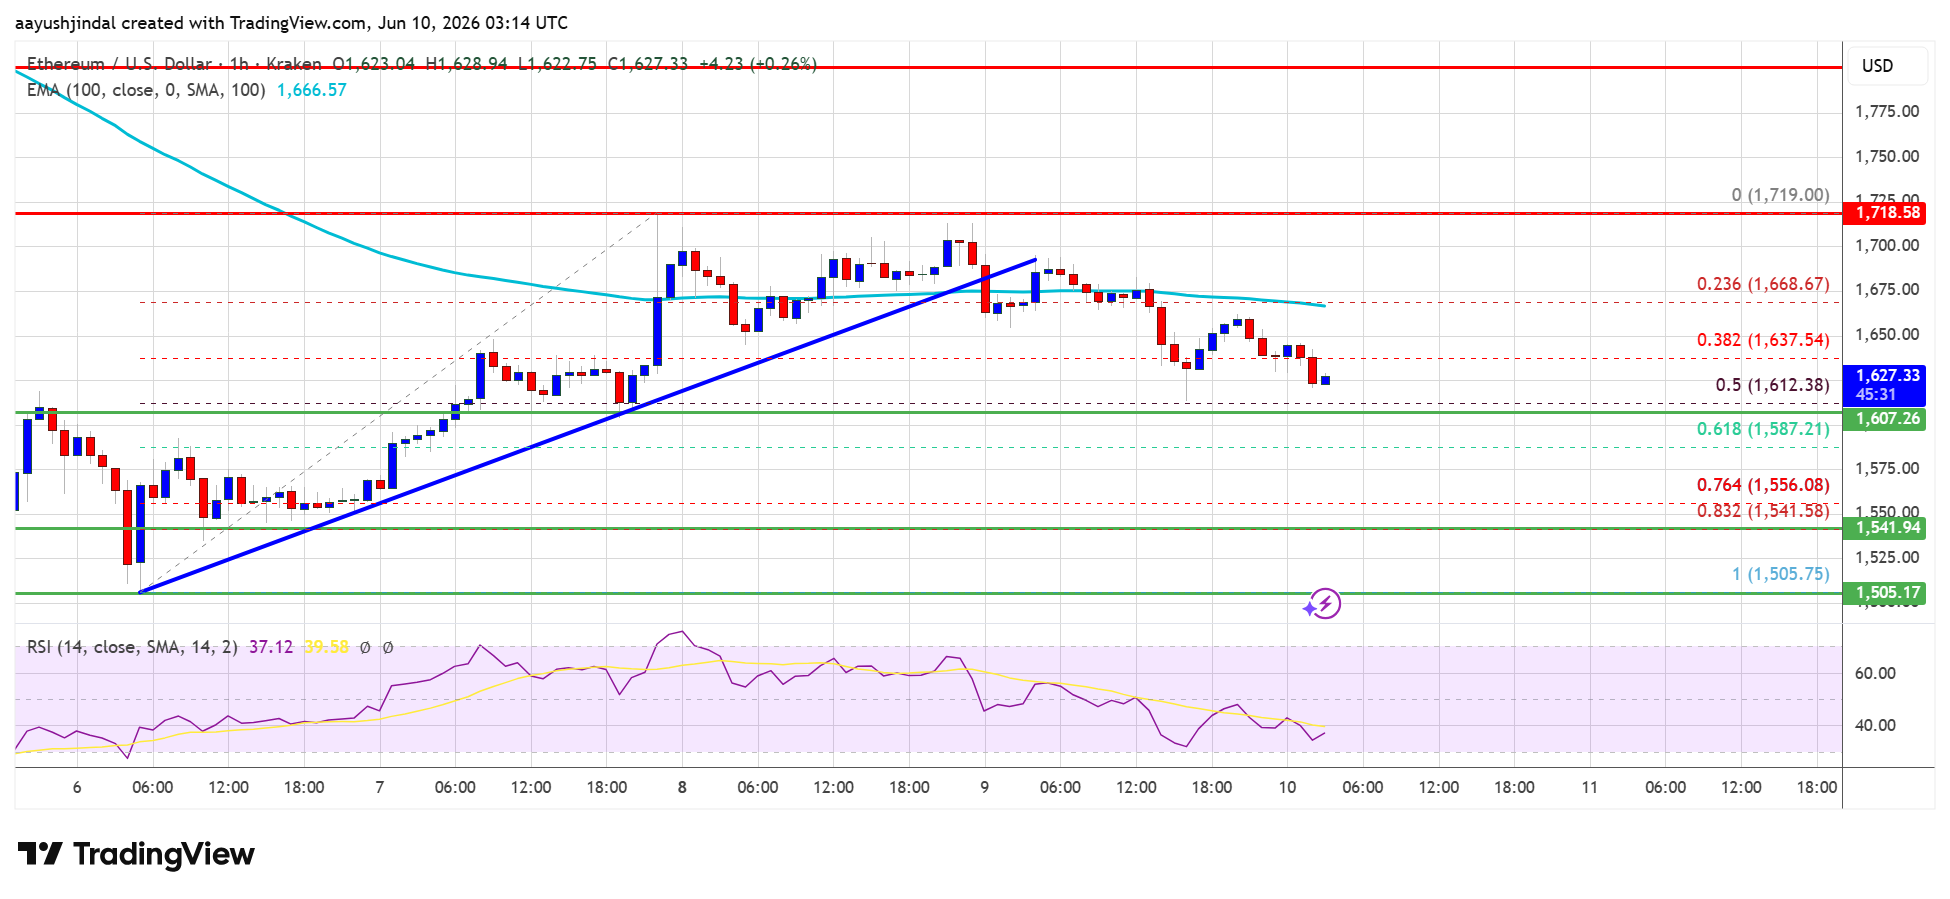
Sellers broke an hourly uptrend near $1,700 and the 38.2% Fib of $1,505–$1,719. Price sits under $1,665 and the 100‑hour SMA. The move tracks Bitcoin weakness seen in NewsBTC’s BTC update. Levels and signals come from NewsBTC’s ETH technical view and the chart below.
Key levels
- Resistance: $1,665, $1,680, $1,710. Above $1,710 opens $1,750, then $1,840–$1,850 per chart.
- Support: $1,610, then $1,585 (61.8% Fib), $1,550, $1,520, $1,500 per chart.
Indicators
- Hourly MACD: bearish momentum NewsBTC ETH view.
- Hourly RSI: below 50 NewsBTC ETH view.
What to watch
- A close above $1,710 signals a push toward $1,750 and $1,840–$1,850.
- Staying below $1,680 risks a retest of $1,610 and $1,585.
First mention: Ethereum.