Ethereum fails to break $1,700 resistance, risks decline toward $1,620
Ethereum stalls below $1,700 after a brief rebound above $1,620. Price holds under $1,680 and the 100‑hour SMA.
Moves track Ethereum’s bounce alongside Bitcoin’s recovery noted by NewsBTC in its BTC analysis.
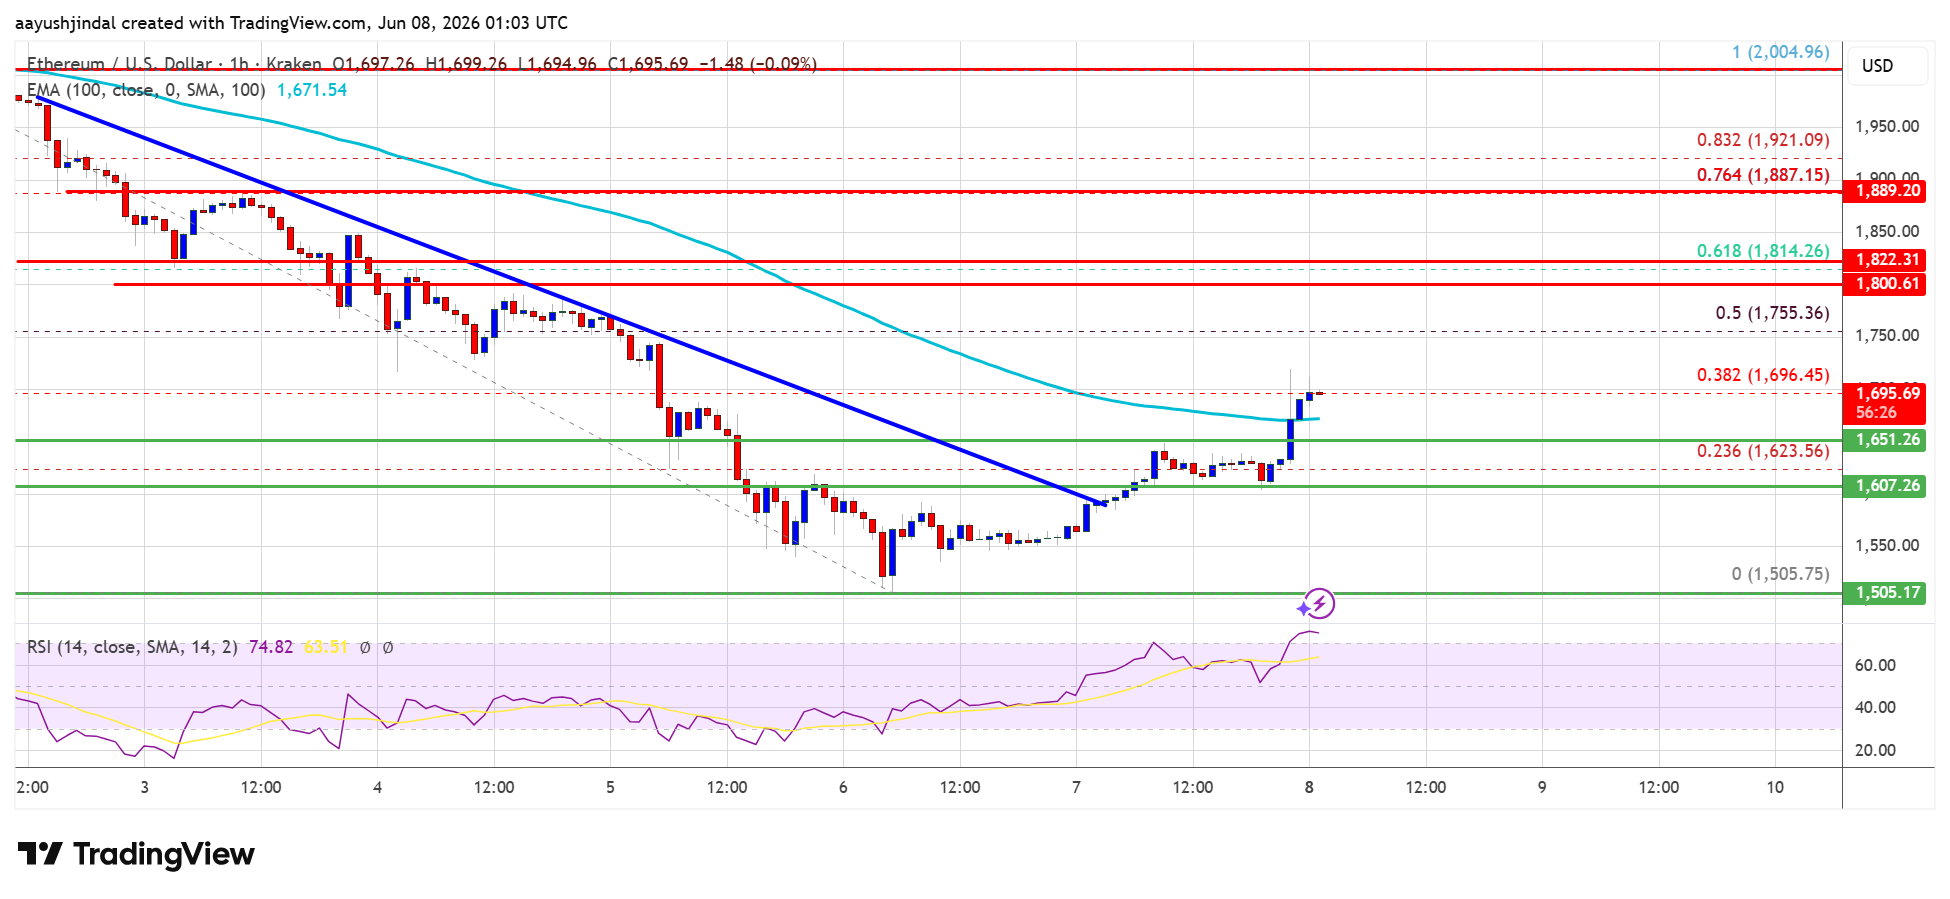
- Price reclaimed $1,620 but failed at $1,700. ETH trades below $1,680 and the 100‑hour SMA (100‑hour SMA context) [NewsBTC ETH hourly chart].
- Intraday bullish trendline broke at $1,685 on ETH/USD hourly. Sellers defended the area [chart].
- Resistance: $1,680 first, then $1,700. Above that, $1,750 aligns with the 50% Fib of the $2,005–$1,505 move; next $1,800–$1,880 [chart].
- Support: $1,650 initial, then $1,620. Below, $1,580–$1,550; main support sits at $1,500 [chart].
- Indicators: Hourly MACD turns more negative; RSI stays under 50 [chart].
If price remains capped at $1,700, a fresh decline toward $1,650 and $1,620 is in play. A clean break above $1,750 would shift focus to $1,800–$1,880 [chart].