Analyst signals Ethereum golden triangle, targets $2,800 as first recovery level
Analysts flag ETH ‘golden triangle’ breakout; $2.8k next, $12k+ by 2027–2028
Two X analysts see Ethereum nearing a macro breakout that could kick off an altcoin rally. They map a near-term move to $2,800 and a longer arc above $12,000 by 2027–2028, based on multi‑year chart structures covered here.
A 3‑week chart since 2017 shows ETH compressing into a “golden triangle”: a rising lower trendline from the March 2020 low and a horizontal cap from the 2021, 2024, and 2025 peaks. The technician behind the setup expects an upside resolution and parabolic leg if resistance breaks source. NewsBTC tracks the same projected breakout path beyond $12k into 2027–2028 and links it to a broader altcoin rotation report.
ETH is testing the lower bound of that triangle while holding a higher low versus the 2025 trough, per the cited charts. The parabolic scenario assumes a bounce from current support and a clean break over the horizontal ceiling analysis.
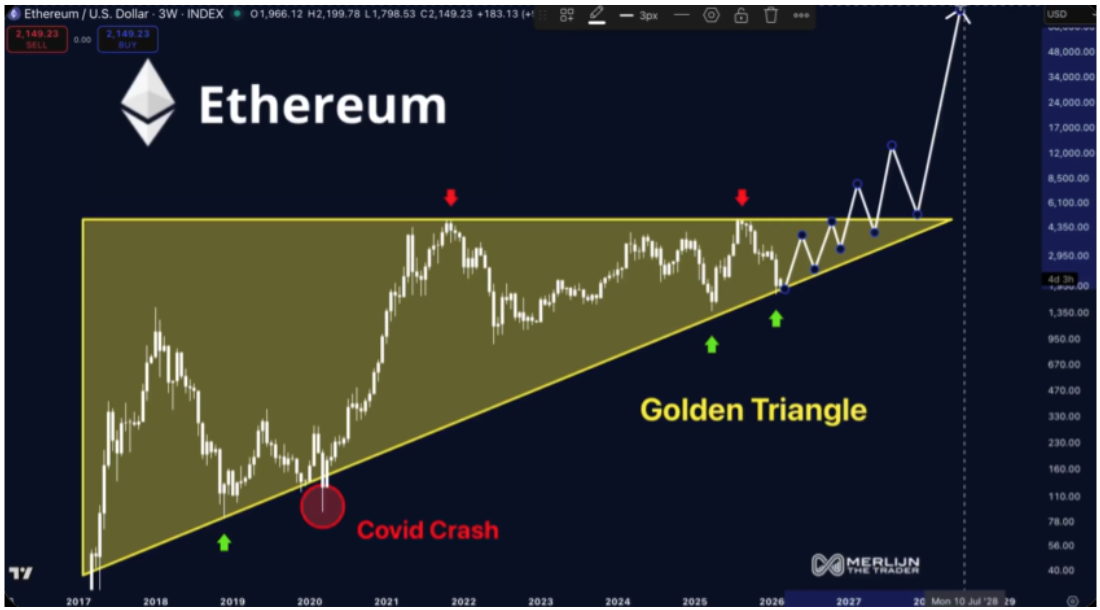
Ethereum’s Golden Triangle. Source: @zenkaixbt
Near term, analyst Crypto Feras maps a 3‑day structure that’s held since February despite macro headlines, arguing structure outweighs short‑term newsflow. He cites on‑chain and market context as ETH maintains its pattern through Middle East tensions and exchange reserve shifts thread reserves data market move.
His rising diagonal support links the 2022, 2023, and 2025 lows—each followed by rallies of 91.72%, 167.79%, and 223% respectively. The 2026 local low near $1,800 (February) sets the next targets at $2,800, then $3,393 if momentum continues chart.
A sustained ETH breakout could extend capital rotation from Bitcoin into altcoins, as tracked by on‑chain flows earlier this cycle on‑chain read.
Authors credited by the source: Scott Matherson
Published by Holder based on an external source.