Saylor’s Strategy buys 1,665 BTC as Bitcoin holds $82,303 support
Michael Saylor’s Strategy increased its Bitcoin position despite higher prices: it bought 1,665 BTC at an average of $85,681 in a second consecutive weekly purchase. The firm now holds 847,666 BTC. Bitcoin closed above $84,000 for its highest weekly close in eight months and trades near $83,393, down 1.28% on the day after pulling back from last week’s move above $87,000. Price remains near the breakout zone.
Strategy’s Rationale and Balance Sheet
Strategy sold BTC below $65,000 during the summer to raise liquidity for preferred dividends and debt reduction. It resumed buying last week around $80,000 and added more this week at $85,681. The firm reports:
- BTC holdings: 847,666 BTC acquired for about $64 billion, worth over $70 billion, implying roughly $6 billion in unrealized gains.
- USD assets: $6.02 billion in cash reserves.
- Capital actions: repurchased $152 million of STRC stock.
Two consecutive weekly BTC purchases at rising prices indicate the company views the recovery as a trend.
ETF Flow Context
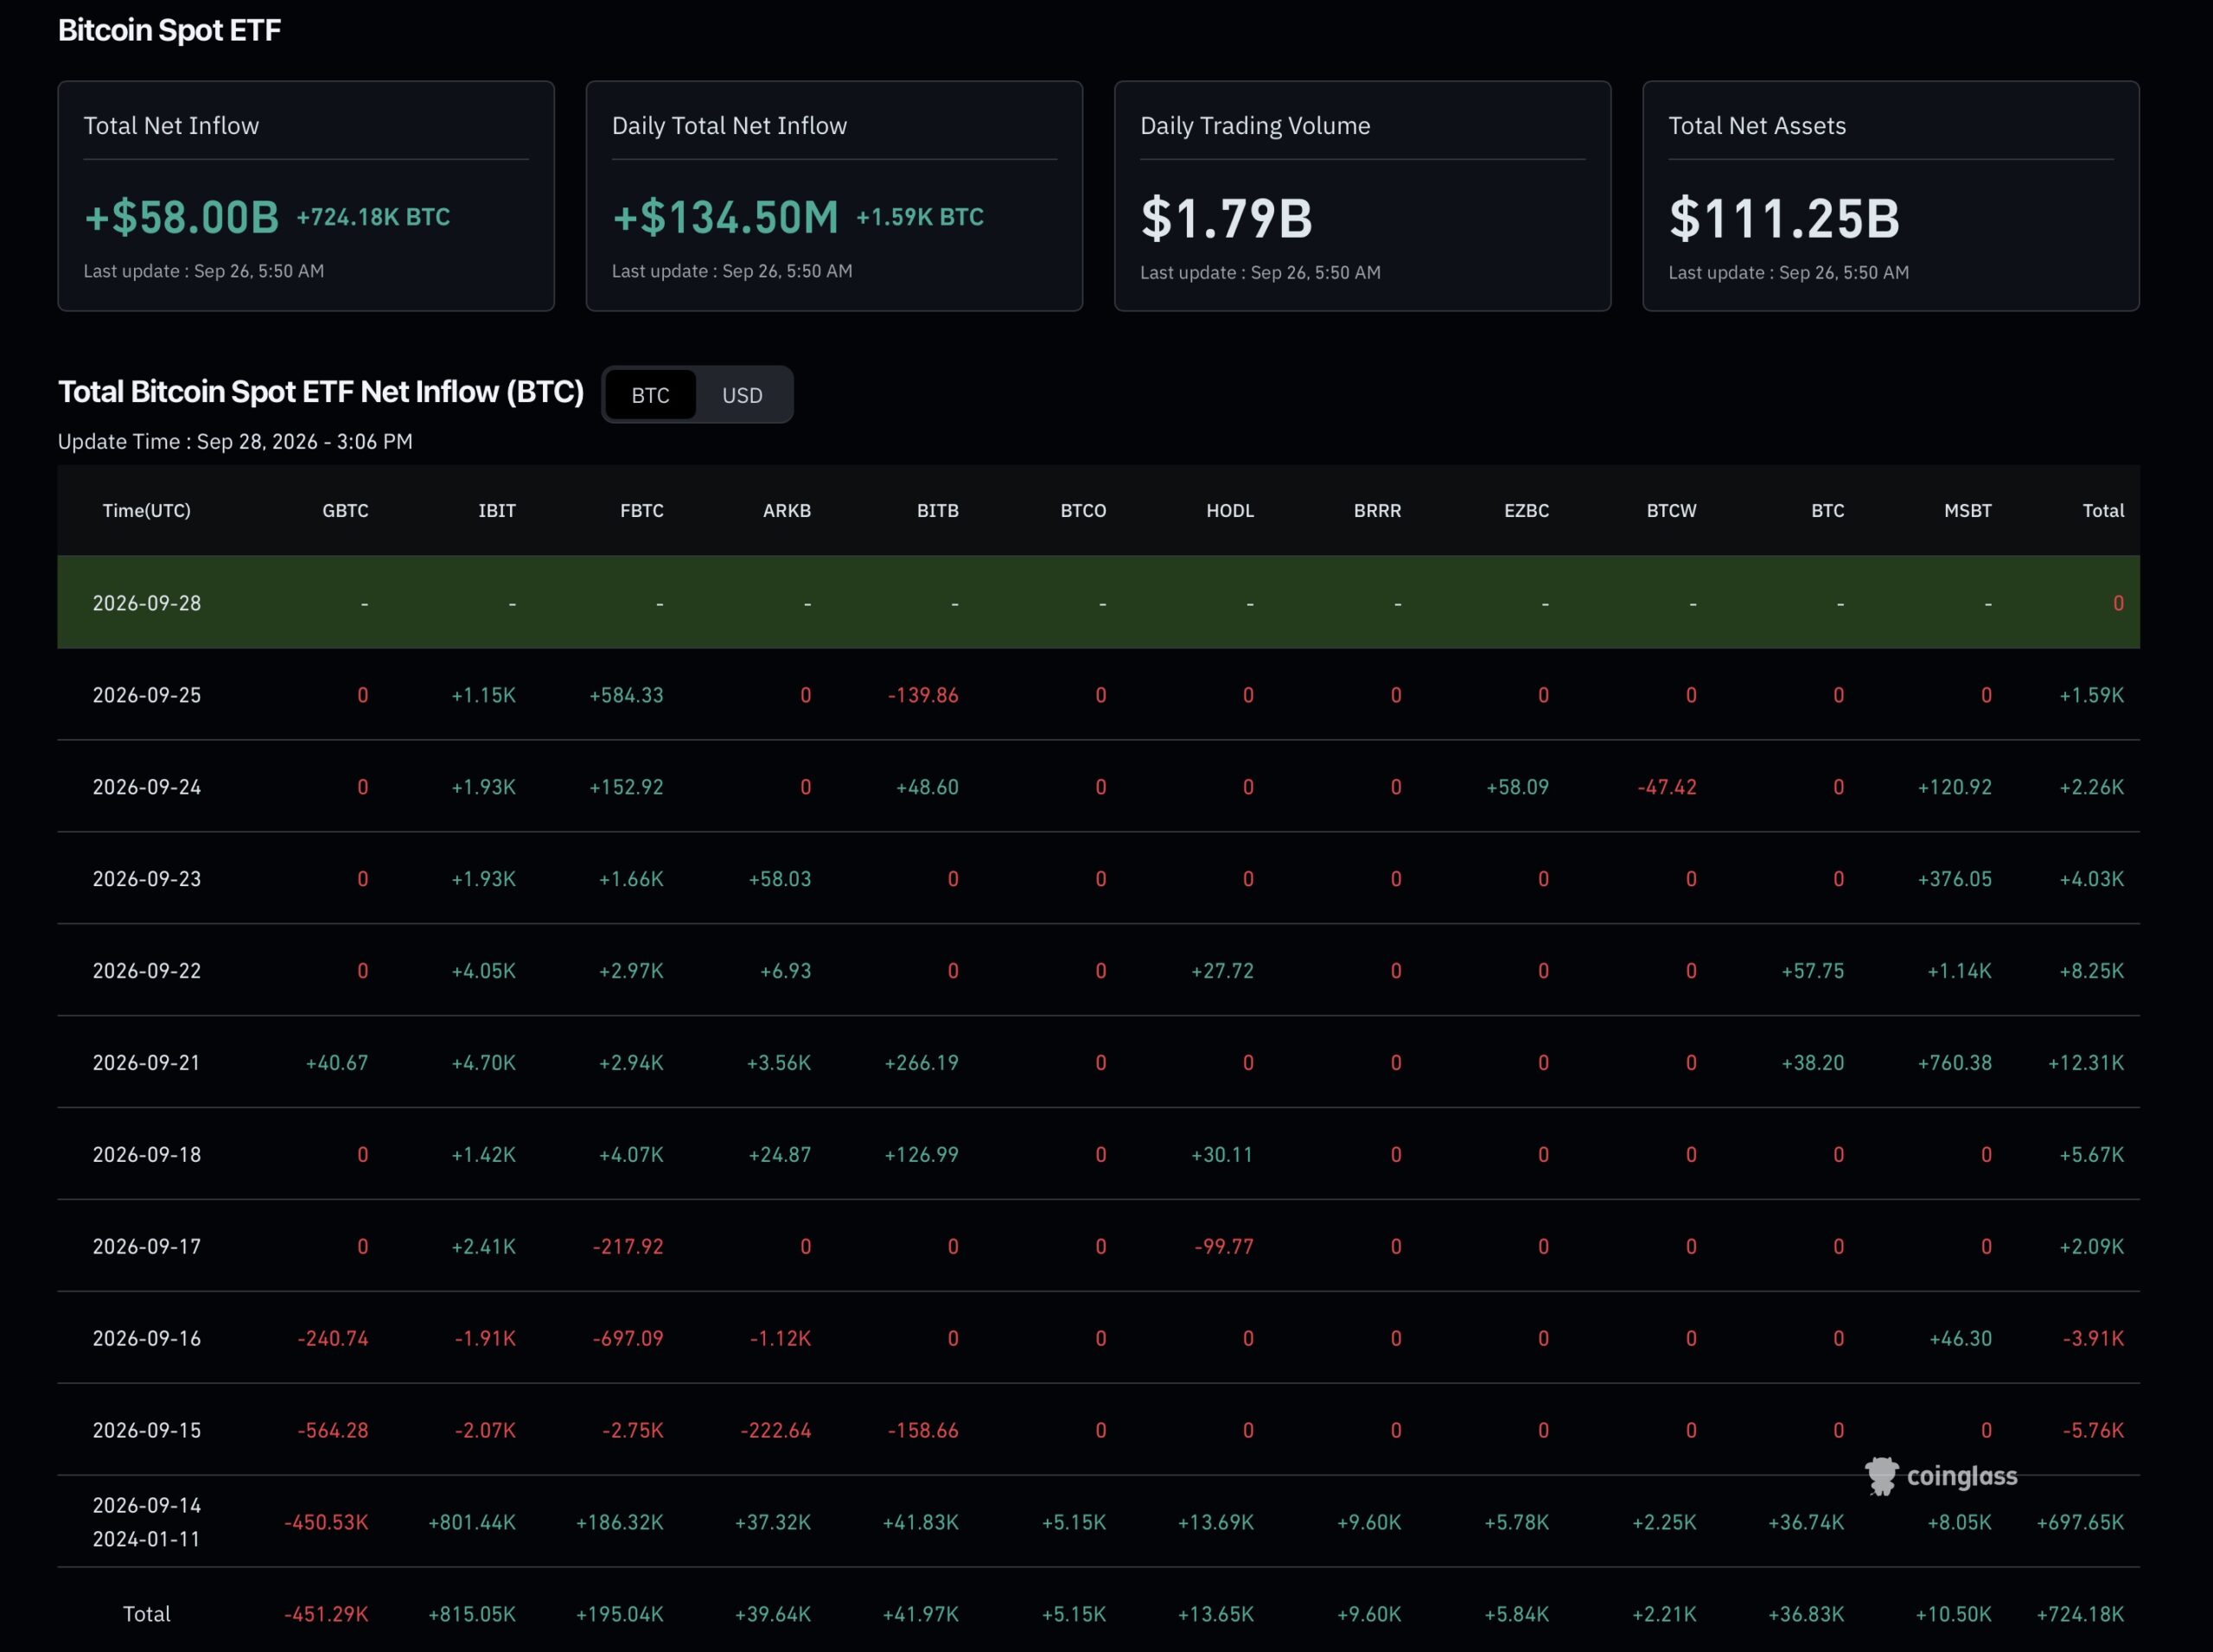
BTC ETF Flows Coinglass
US spot Bitcoin ETF inflows have slowed:
- September 25: +1,590 BTC, about $134.5 million.
- September 21: +12,310 BTC, about $999 million.
- September 22–24: +8,250, +4,030, +2,260 BTC respectively, declining each day.
Total ETF net assets: $111.25 billion. Aggregate ETF BTC holdings: 724,180 BTC. Strategy’s 847,666 BTC exceeds the entire US spot ETF complex, which concentrates holdings in a single corporate treasurer. This concentration provides a large committed holder but introduces a single-point liquidity risk if the firm needs to sell.
Key BTC Levels and Technical Structure
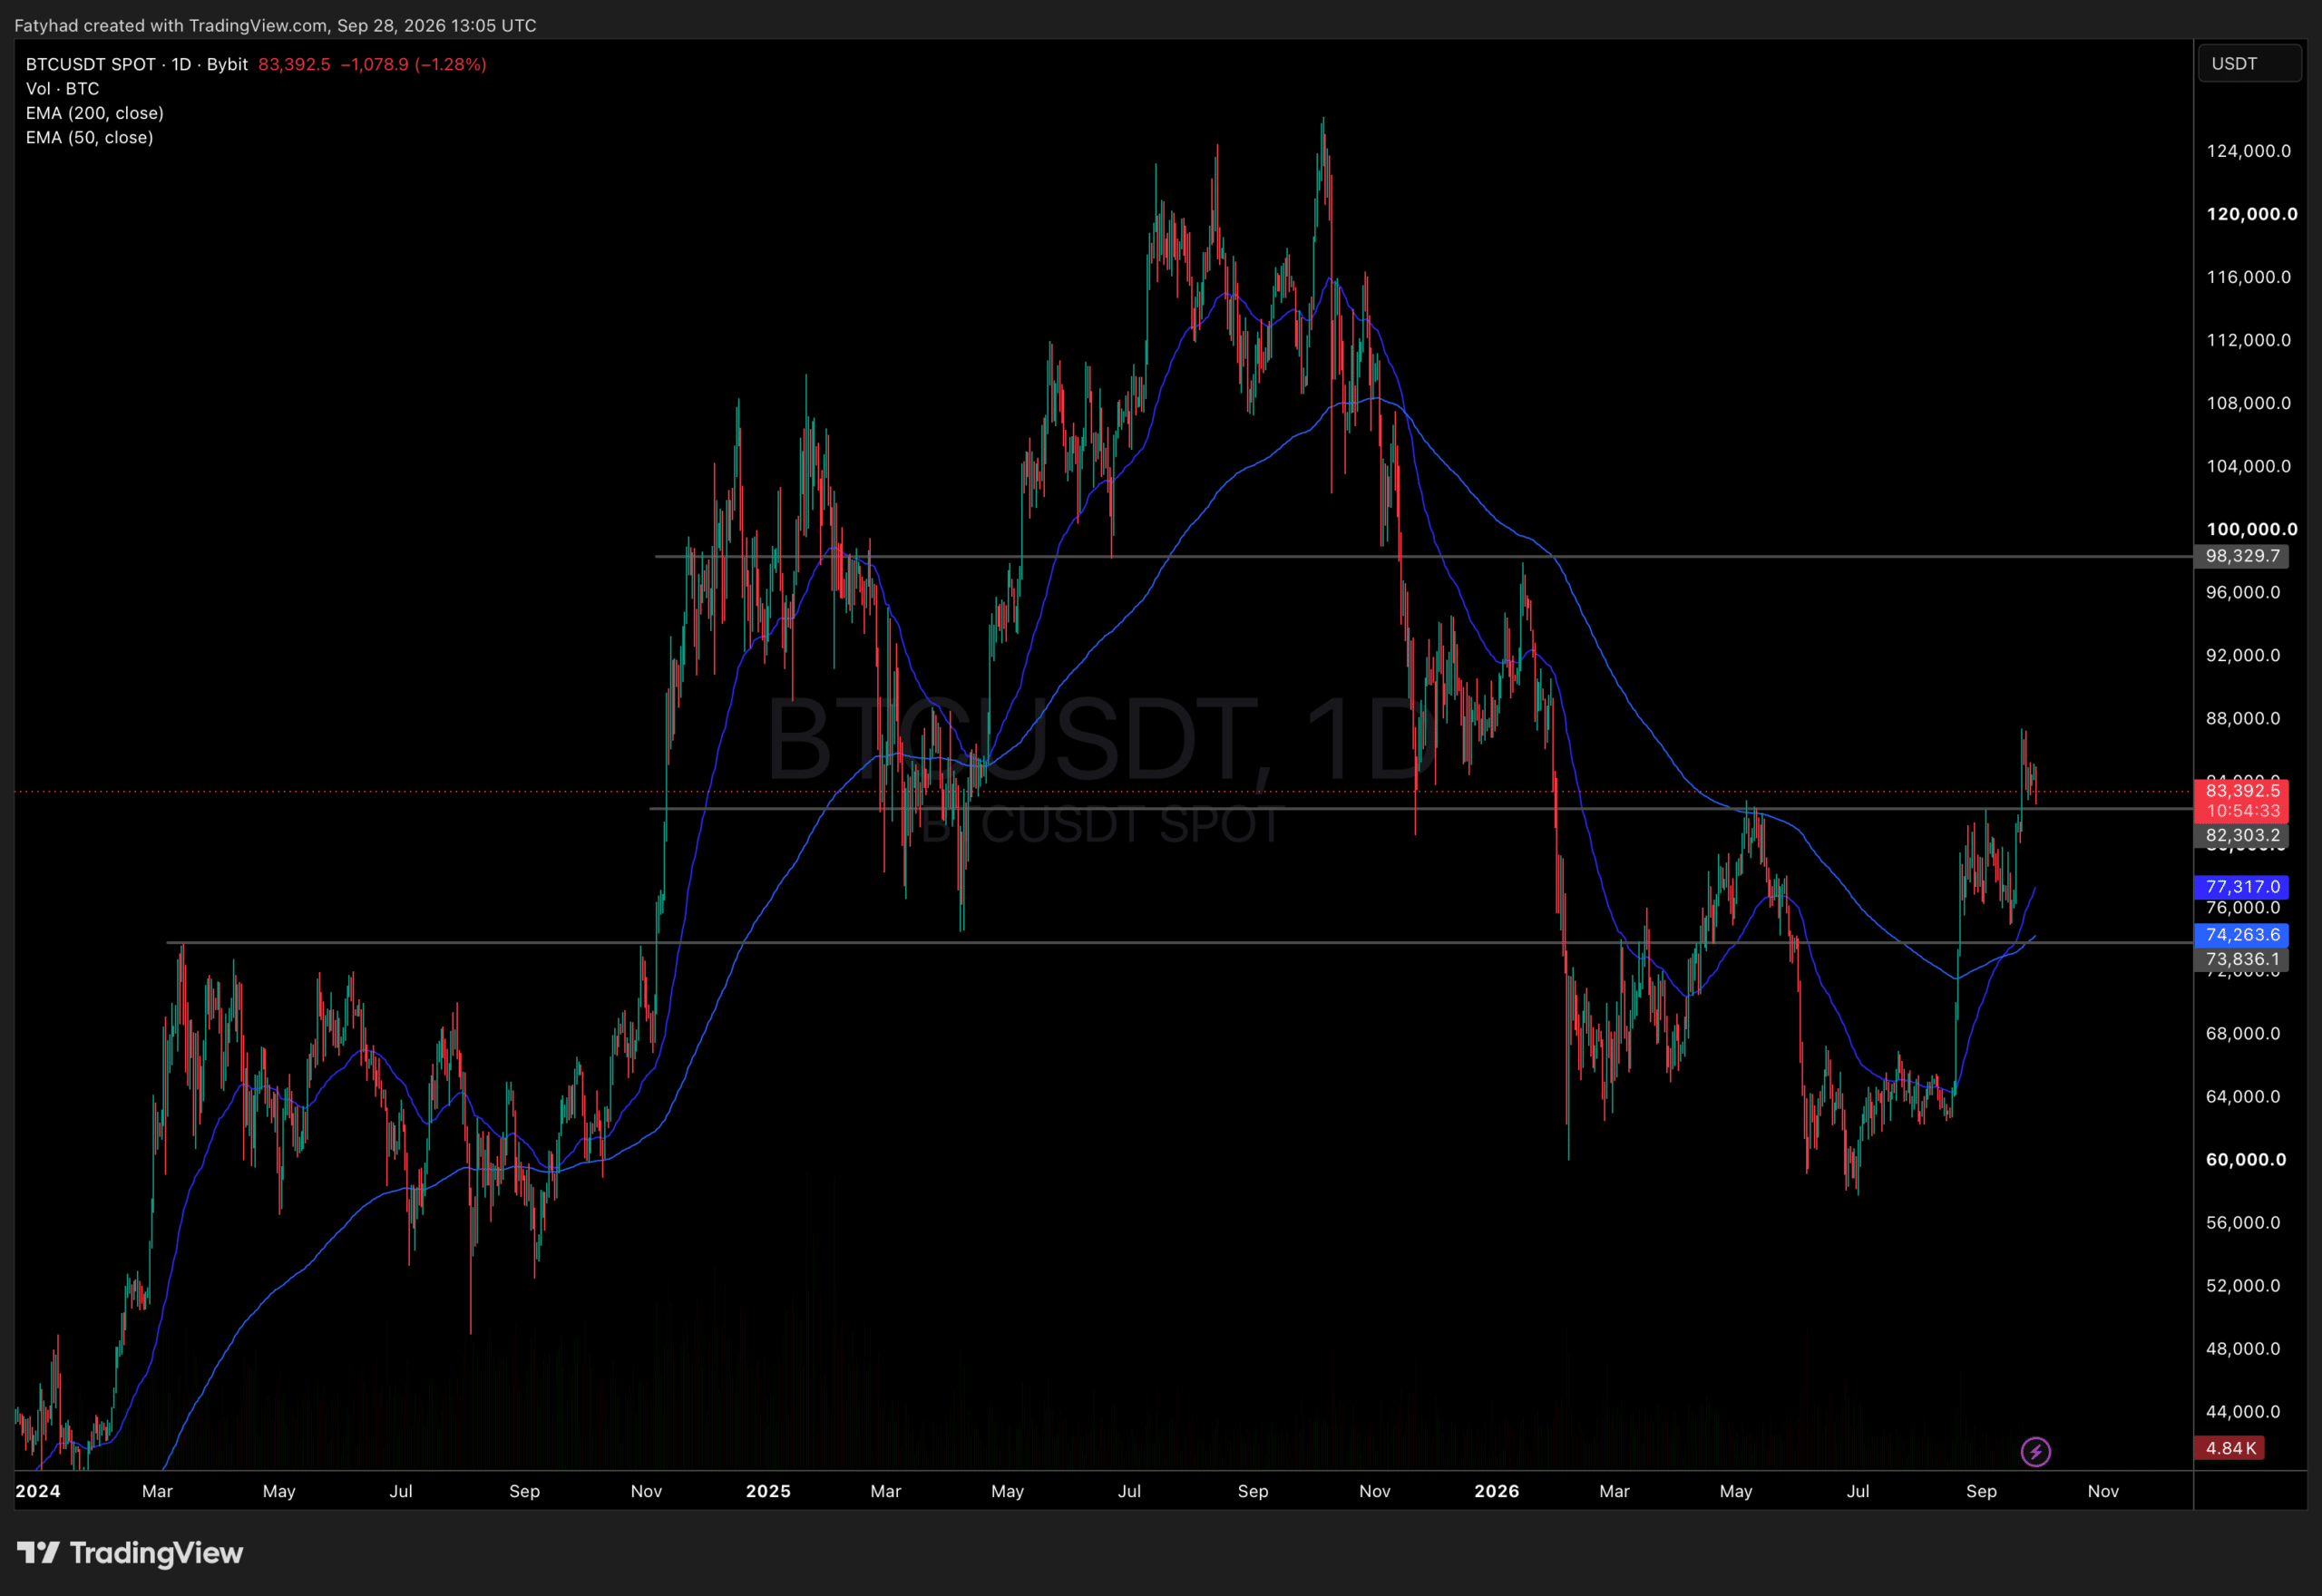
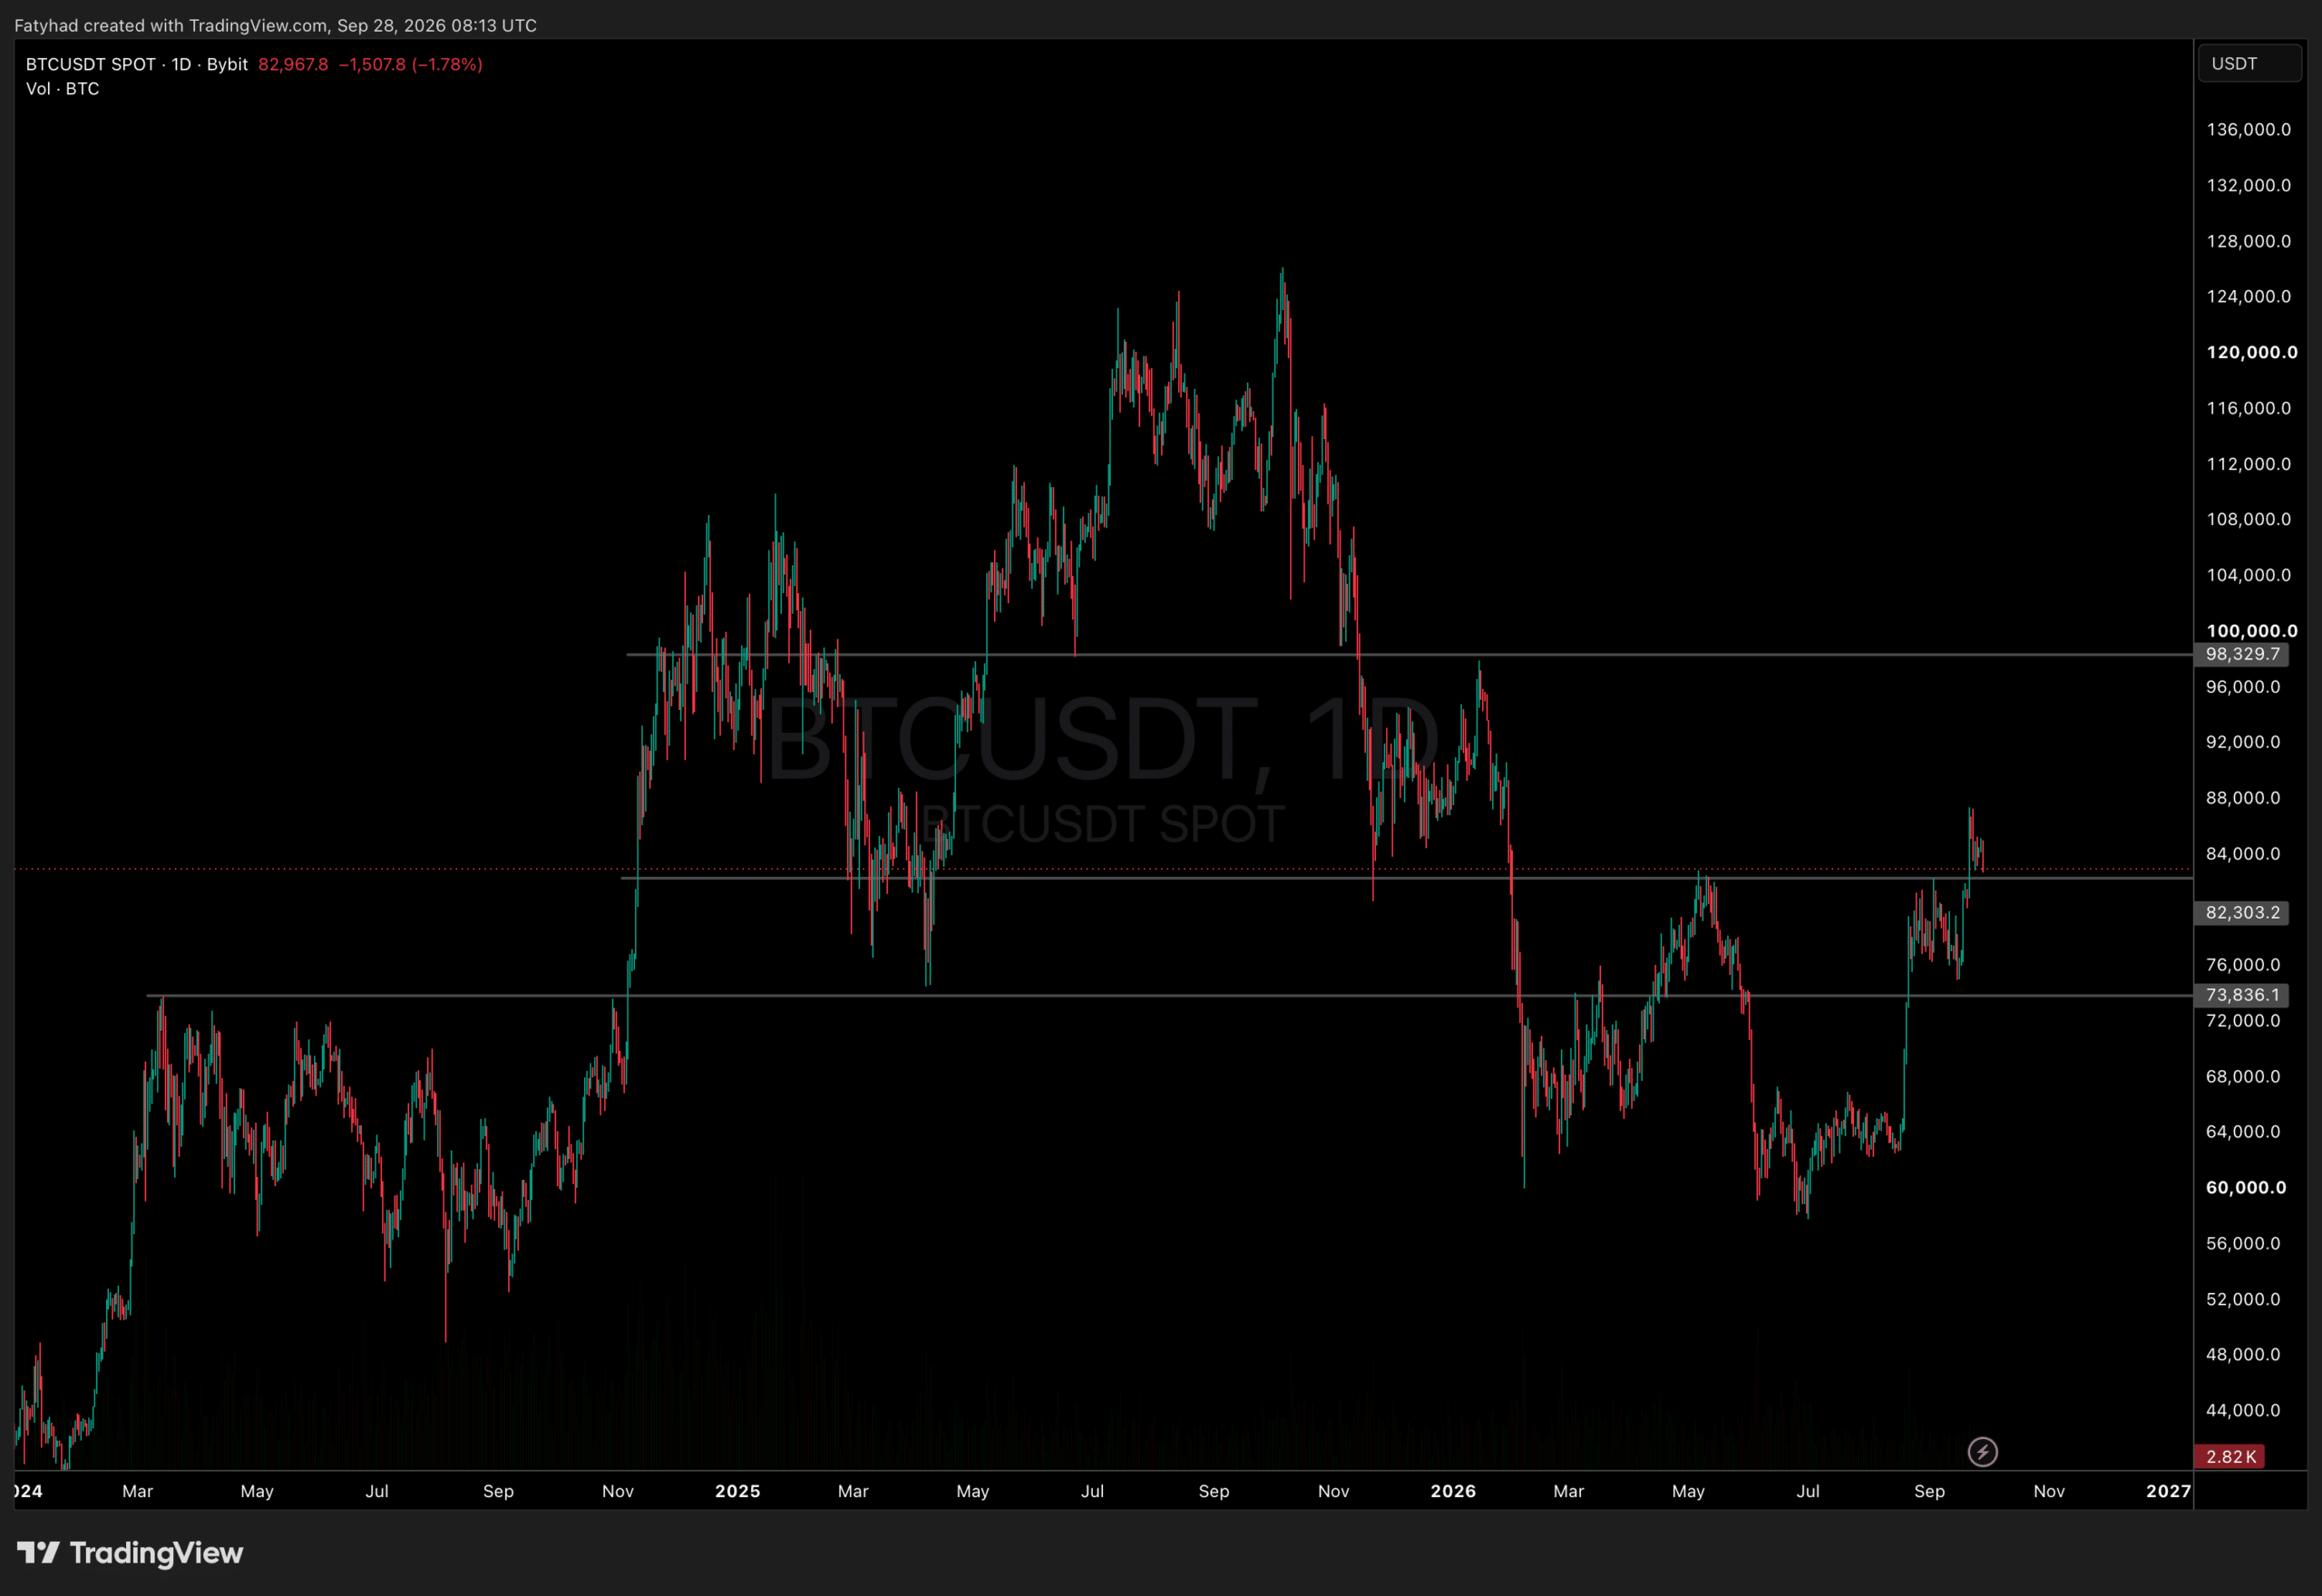
BTCUSDT Chart 1D TradingView
Price cleared $82,303, a prior rejection level from May and September, and is retesting it. Moving averages are rising: the 50-day EMA at $77,317 is above the 200-day EMA at $74,264.
- Support to hold: $82,303. Maintaining daily closes above keeps the breakout intact.
- Upside targets: $88,000–$90,000 supply band; then $98,330 as the final barrier before $100,000.
- Downside backstops: $77,317 and $74,264, a zone that has supported pullbacks since August.
Risk factors: corporate demand supports trend but does not preclude corrections. ETF inflows are moderating while price tests support. Holding $82,303 suggests consolidation; a loss of that level raises the probability that last week’s high was a local top.