10 1
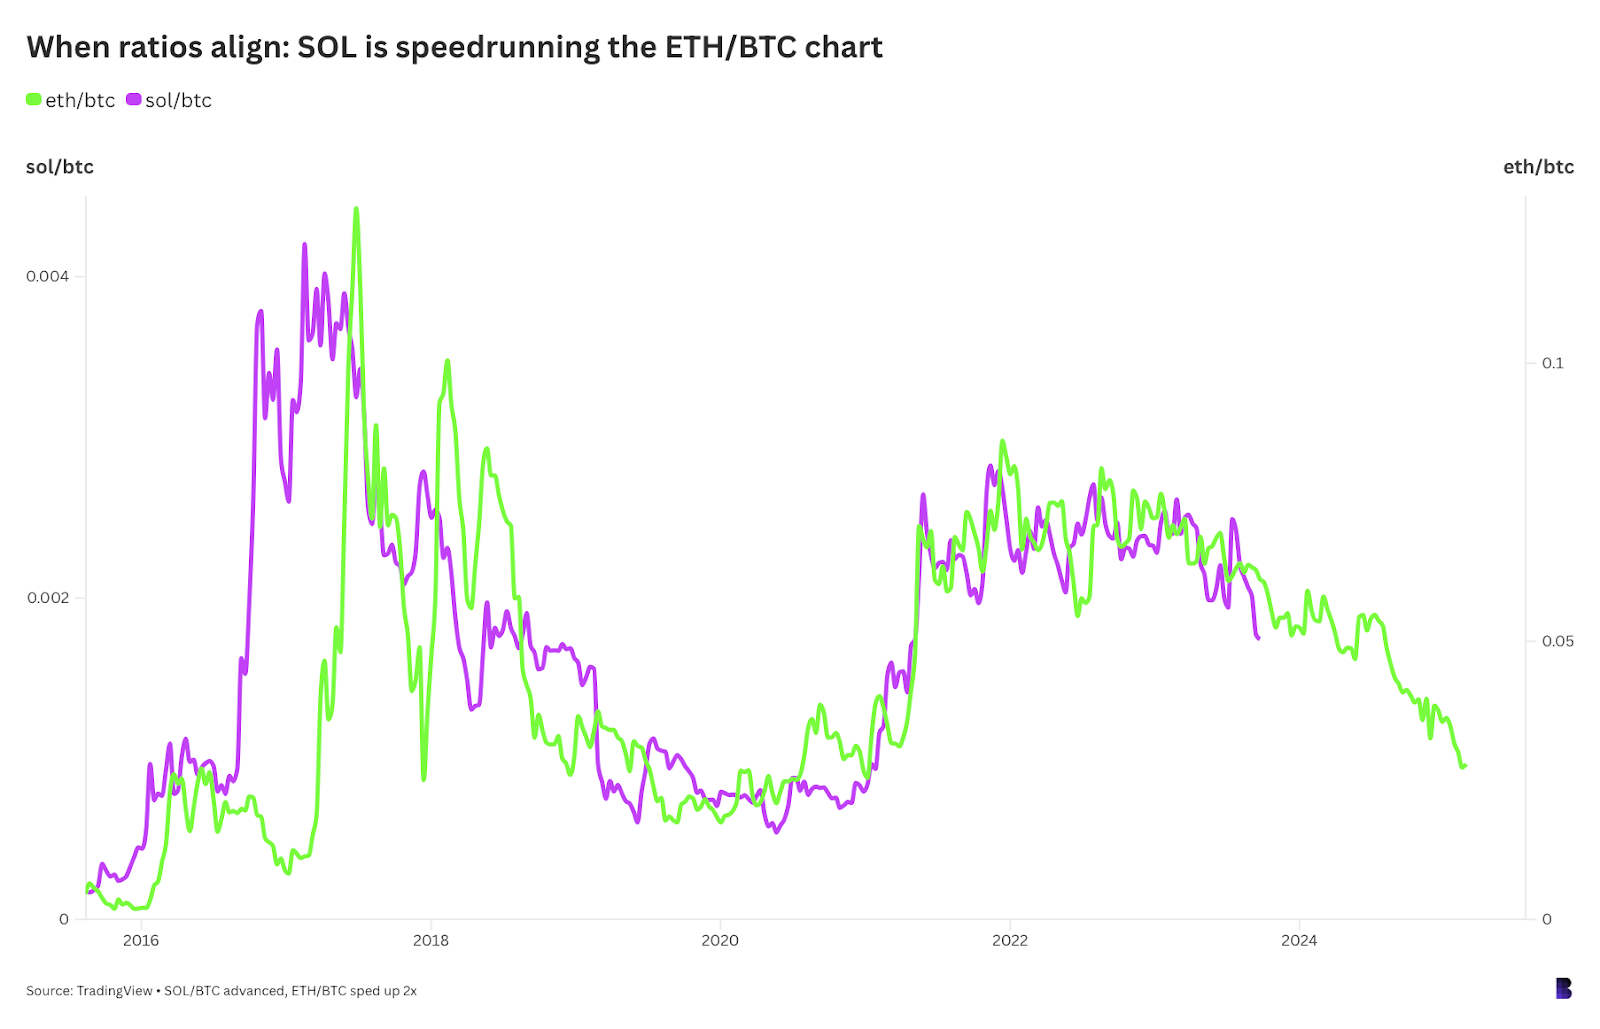
Solana’s Bitcoin Ratio Chart Mirrors Ethereum’s Historical Trajectory
Recent analysis highlights the similar performance trajectories of ETH and SOL against BTC. Key points include:
- The SOL/BTC ratio mirrors the ETH/BTC ratio closely.
- Both coins saw initial price spikes during their first bull markets: ETH in 2017 and SOL in 2021, followed by declines in bear markets.
- ETH/BTC has trended sideways since May 2021 before dropping over 60% recently.
- SOL/BTC has shown limited movement since December 2023, resembling ETH/BTC's performance in mid-2023.
- ETH's year-on-year returns turned negative recently, marking a potential transition point between bull and bear markets.
The correlation suggests that a rising price for ETH could positively impact SOL's performance against BTC.