XRP drops below $1.15 after trendline break, eyes $1.10 support
XRP slips below $1.15 and the 100-hour SMA. Bears watch $1.10 next.
The drop followed weakness in Bitcoin and Ethereum reported by NewsBTC (Bitcoin price stumbles near $64K, Ethereum rebound runs out of fuel).
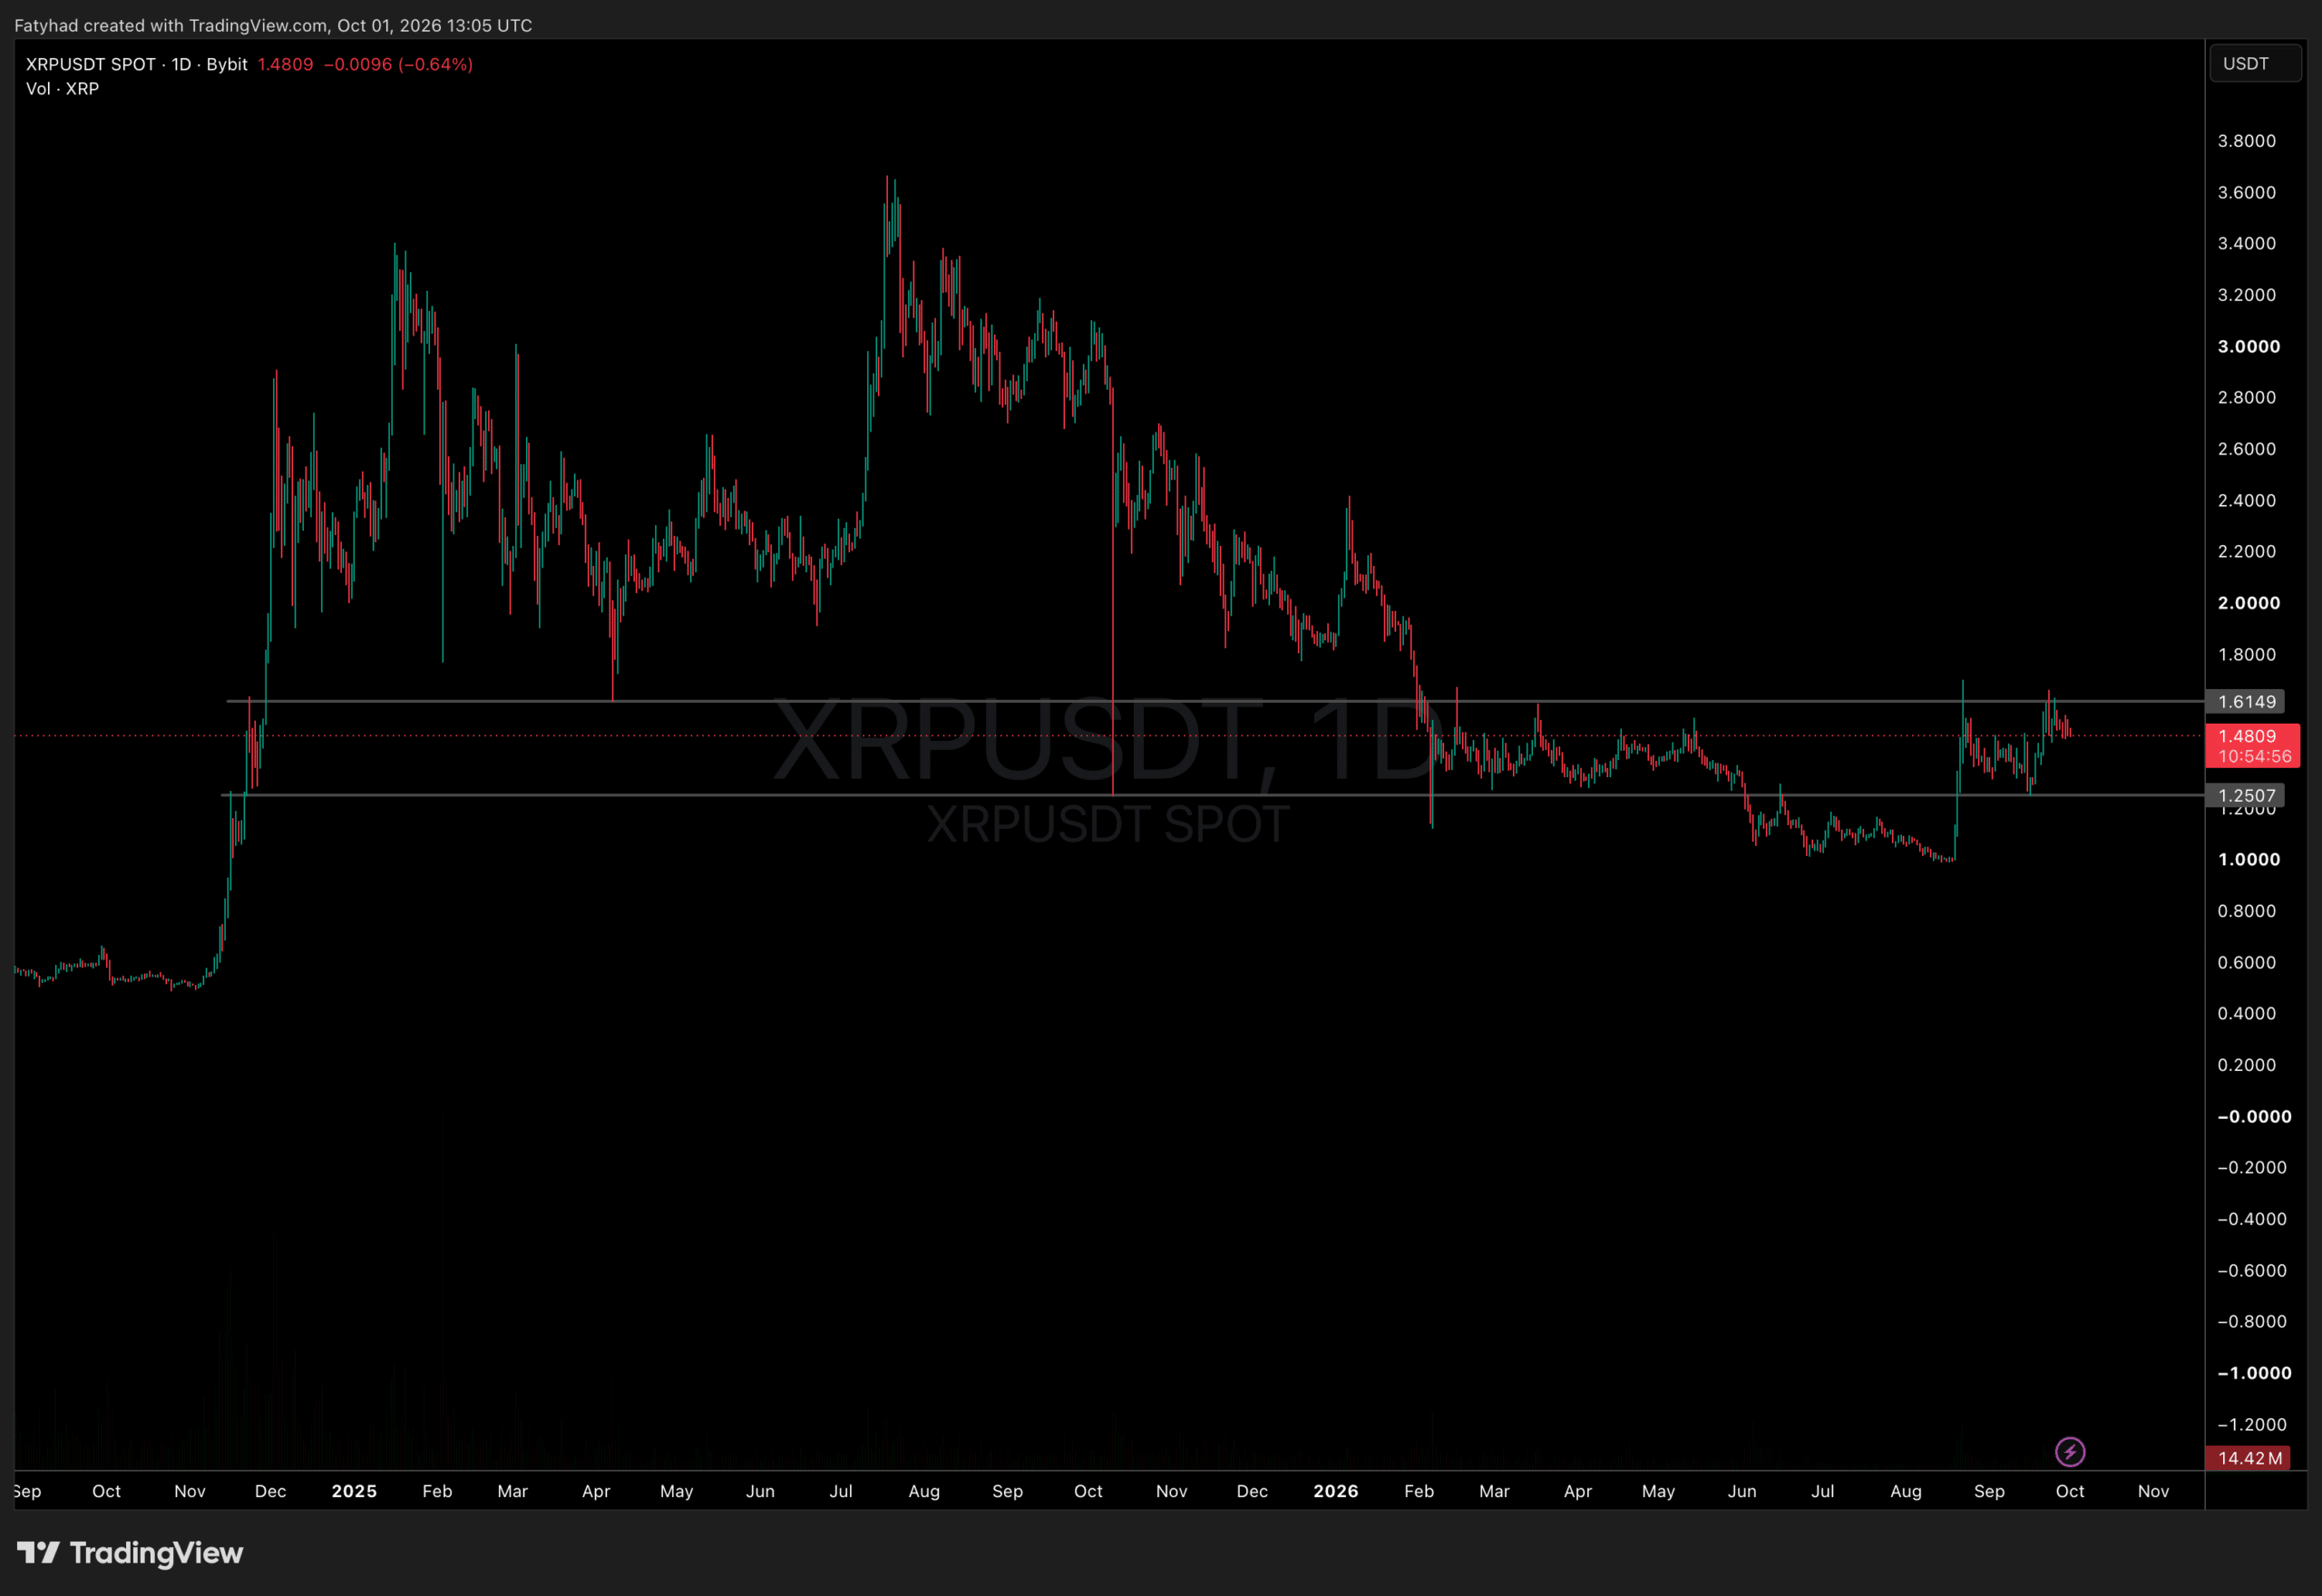
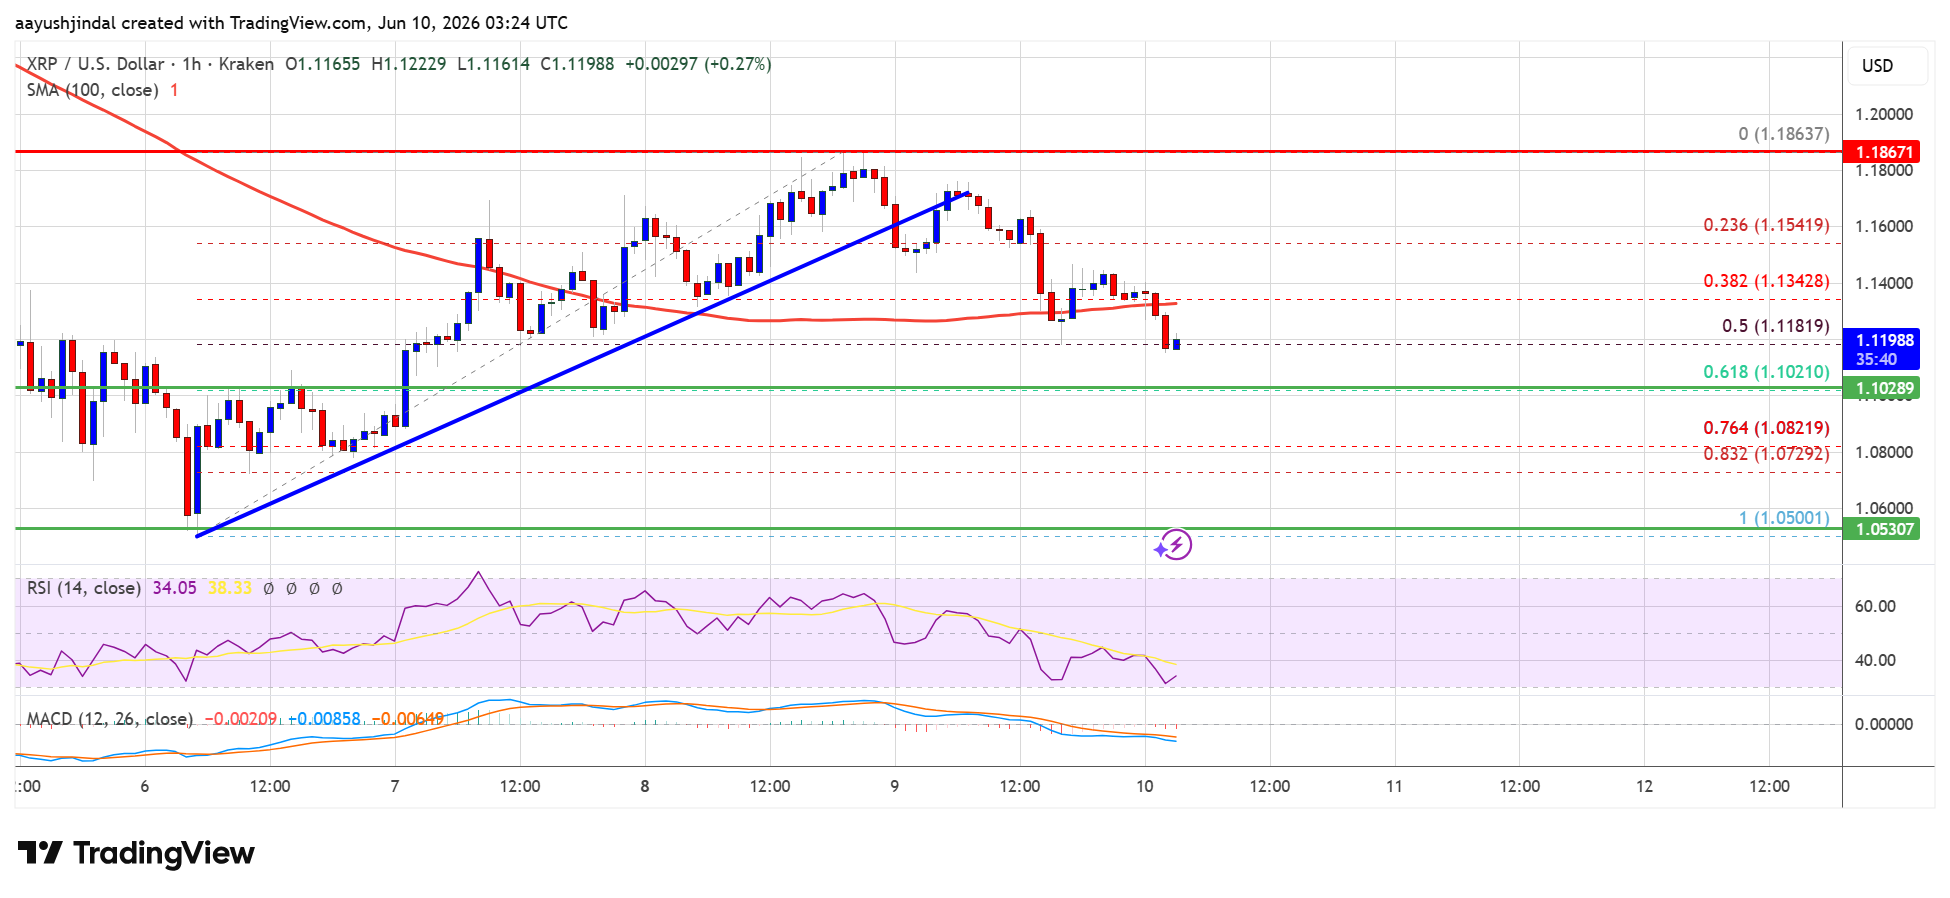
XRP broke an hourly bullish trendline at $1.1620 and slid under $1.160 and $1.1550. It also fell through the 38.2% Fib of the $1.050 to $1.1863 leg. Price now trades below $1.150 and the 100-hour SMA. See the hourly chart: NewsBTC XRP hourly chart.
Upside levels if it bounces:
- $1.1350 initial resistance
- $1.1420 first major cap
- $1.150 reclaim to open $1.1580, then $1.1650
- $1.1840 remains the key hurdle
Downside levels if $1.150 stays intact:
- $1.1072 support; break and close below points to $1.1020
- $1.10 zone next
- Then $1.080
- Deeper test at $1.050
Indicators:
- MACD on XRP/USD turns more bearish
- RSI below 50
Data source for XRP/USD: Kraken; chart via NewsBTC (hourly chart).