Analysts say Bitcoin builds base near $68k before rally
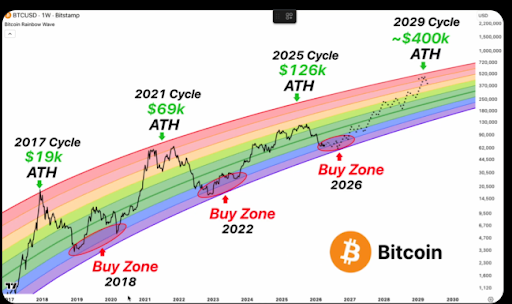
Bitcoin keeps ranging near $65k–$68k. Analyst Kabuki says the rainbow chart shows an accumulation base before the next leg.
He argues the range isn’t random, but a repeat of 2017 and 2021 when bases formed before parabolic expansions on X.
Kabuki’s chart maps a path to as high as $400k in the next bull cycle with a potential top in 2029, and flags the current zone as a “buy” region source.
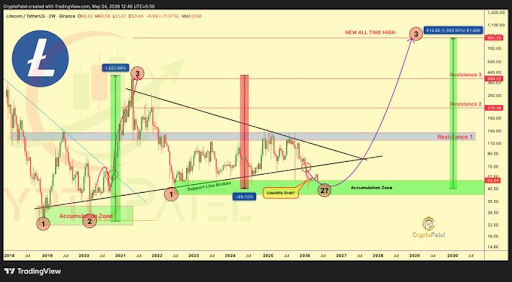
- He also outlines a bearish path first, from ~$69k down to ~$42k, citing a descending channel from an ATH he places near ~$125k, followed by a shakeout and a run to ~$200k on X.
- Analyst Colin says BTC is back inside a bear flag, which can precede a bullish reversal, but caps near-term upside around ~$80k even if the U.S.–Iran war ends; BTC must clear nearby resistance first source.
- Colin adds any short pump is likely sold, with the broader downtrend intact until a break of the major trendline confirms a true structure change on X.
Spot price: ~$68,700 at press time, down on the day, per CoinMarketCap data.