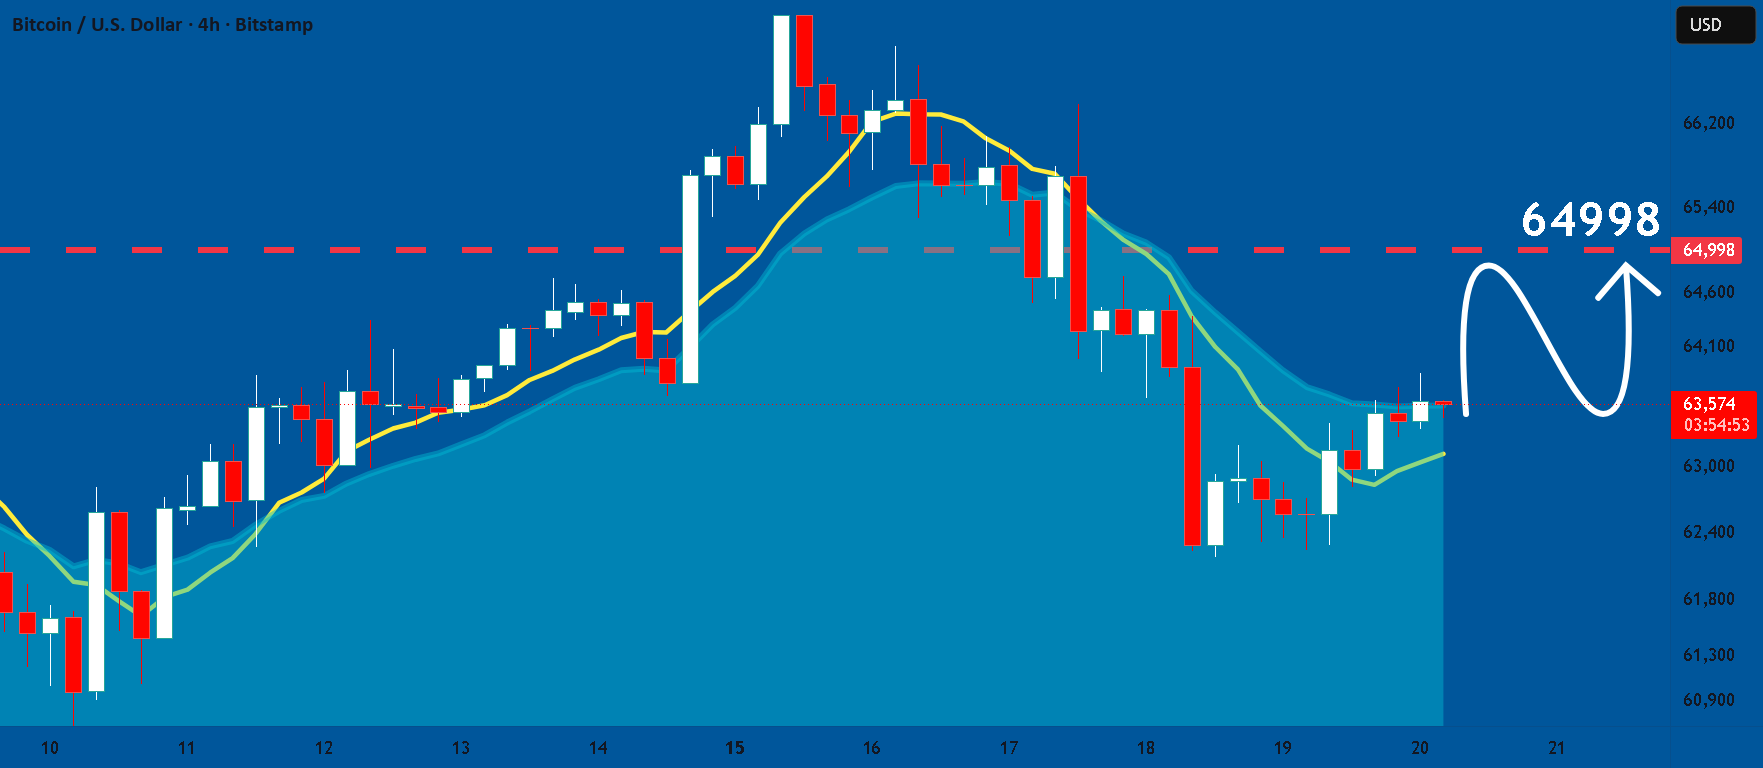
Bitcoin RSI Levels Suggest Approaching Market Bottom
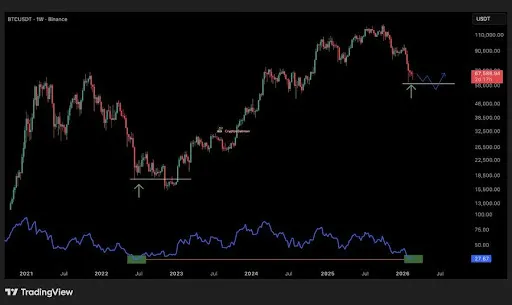
Bitcoin's weekly RSI levels are at points typically seen near bear market bottoms, suggesting selling pressure may be easing. Despite this, confirmation is needed to identify a market reversal.
Key Insights on RSI and Market Movement
- Analyst Batman notes Bitcoin’s weekly RSI is in a zone that historically marks bear market bottoms.
- This momentum zone often appears during late-stage capitulation phases, indicating a potential market turning point.
- RSI compression to these levels suggests proximity to a structural low rather than a new collapse.
- Historically, when RSI entered this extreme zone, price reached one final lower low before finding the ultimate bottom.
Market Patterns and Long-term Projections
- Bitcoin has formed six consecutive weekly lower highs, a rare pattern last seen in the 2020 COVID crash.
- Price is below the 200-week EMA and volume Point of Control (POC), with a potential upside if POC is reclaimed before the weekly close.
- The 200-week SMA provides further support, with RSI levels indicating oversold conditions.
- The megaphone formation remains intact, projecting long-term targets potentially above $300,000.
Overall, while current trends indicate potential downside exhaustion, the broader long-term expansion thesis remains valid despite current market compression.