Analyst’s inverted chart signals Dogecoin rally; open interest hits year high
Analyst flips the Dogecoin chart. A “drop” on the inverted monthly implies a rally. Futures OI just hit a year high.
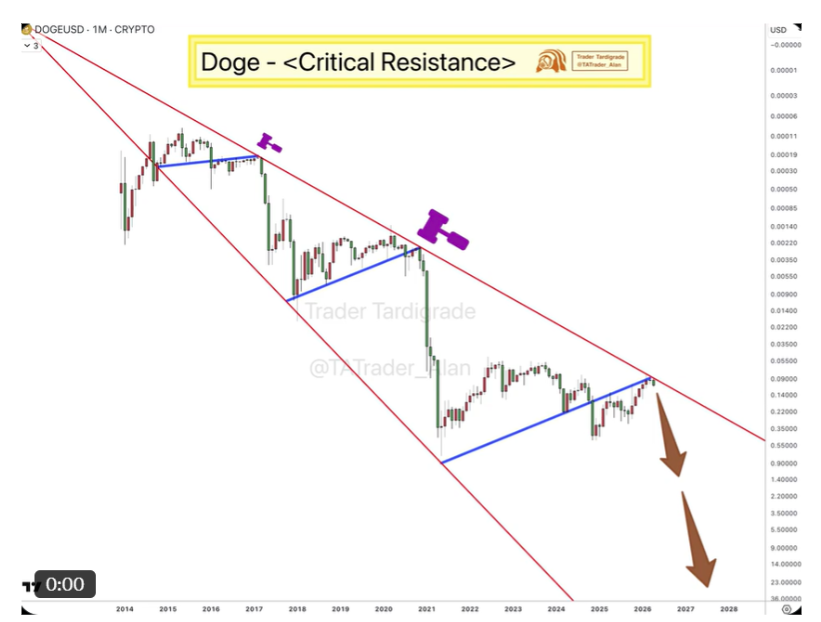
Trader Tardigrade mapped a decade-long, inverted monthly for Dogecoin (DOGE). His X post shows three touch-and-reject events at a red trendline he marks as “critical resistance” on the flipped scale here. On an inverted chart, a downward move equals a rally on the normal price chart explained here.
The same line was flagged earlier as a capped parallel channel level by analysts. The setup mirrors 2017 and 2021, with large inverted “drops” followed by strong real-price rallies seen in prior cycles.
“This drop is coming,” the analyst wrote, referring to the inverted chart move. His projection shows double-digit prices and up to $23 on the long-term path outlined here.
Near-term, DOGE bounced off support. Price tapped $0.11 in the last 24 hours and is up ~10% over seven days source.
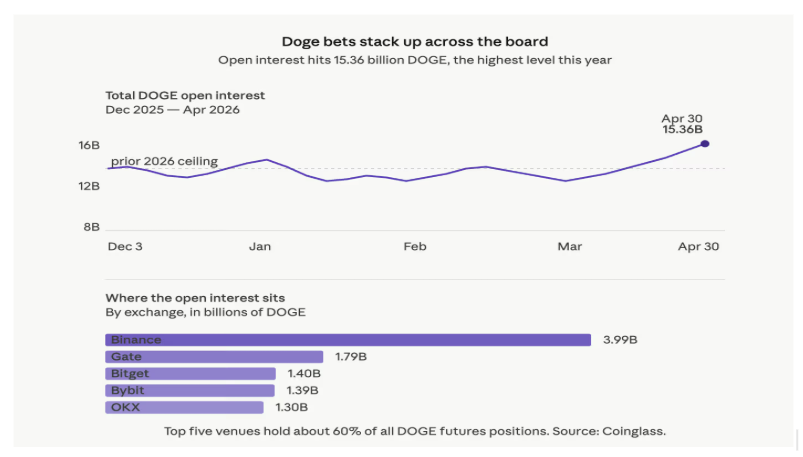
Dogecoin futures open interest is surging. It’s at the highest level this year, with a breakaway noted versus Bitcoin (BTC) here and here.
- Three inverted rejections: 2017, 2021, 2026 chart
- Inversion means “drop” implies rally mechanics
- Projection shows double-digit targets, up to $23 path
- Price bounced to ~$0.11; +10% in 7D price action
- Futures OI at year high; breakaway from BTC Bitcoinist, CoinDesk