8 0
Ethereum Drops Below $2,310 Amid Predictions of $2,000 Support Test
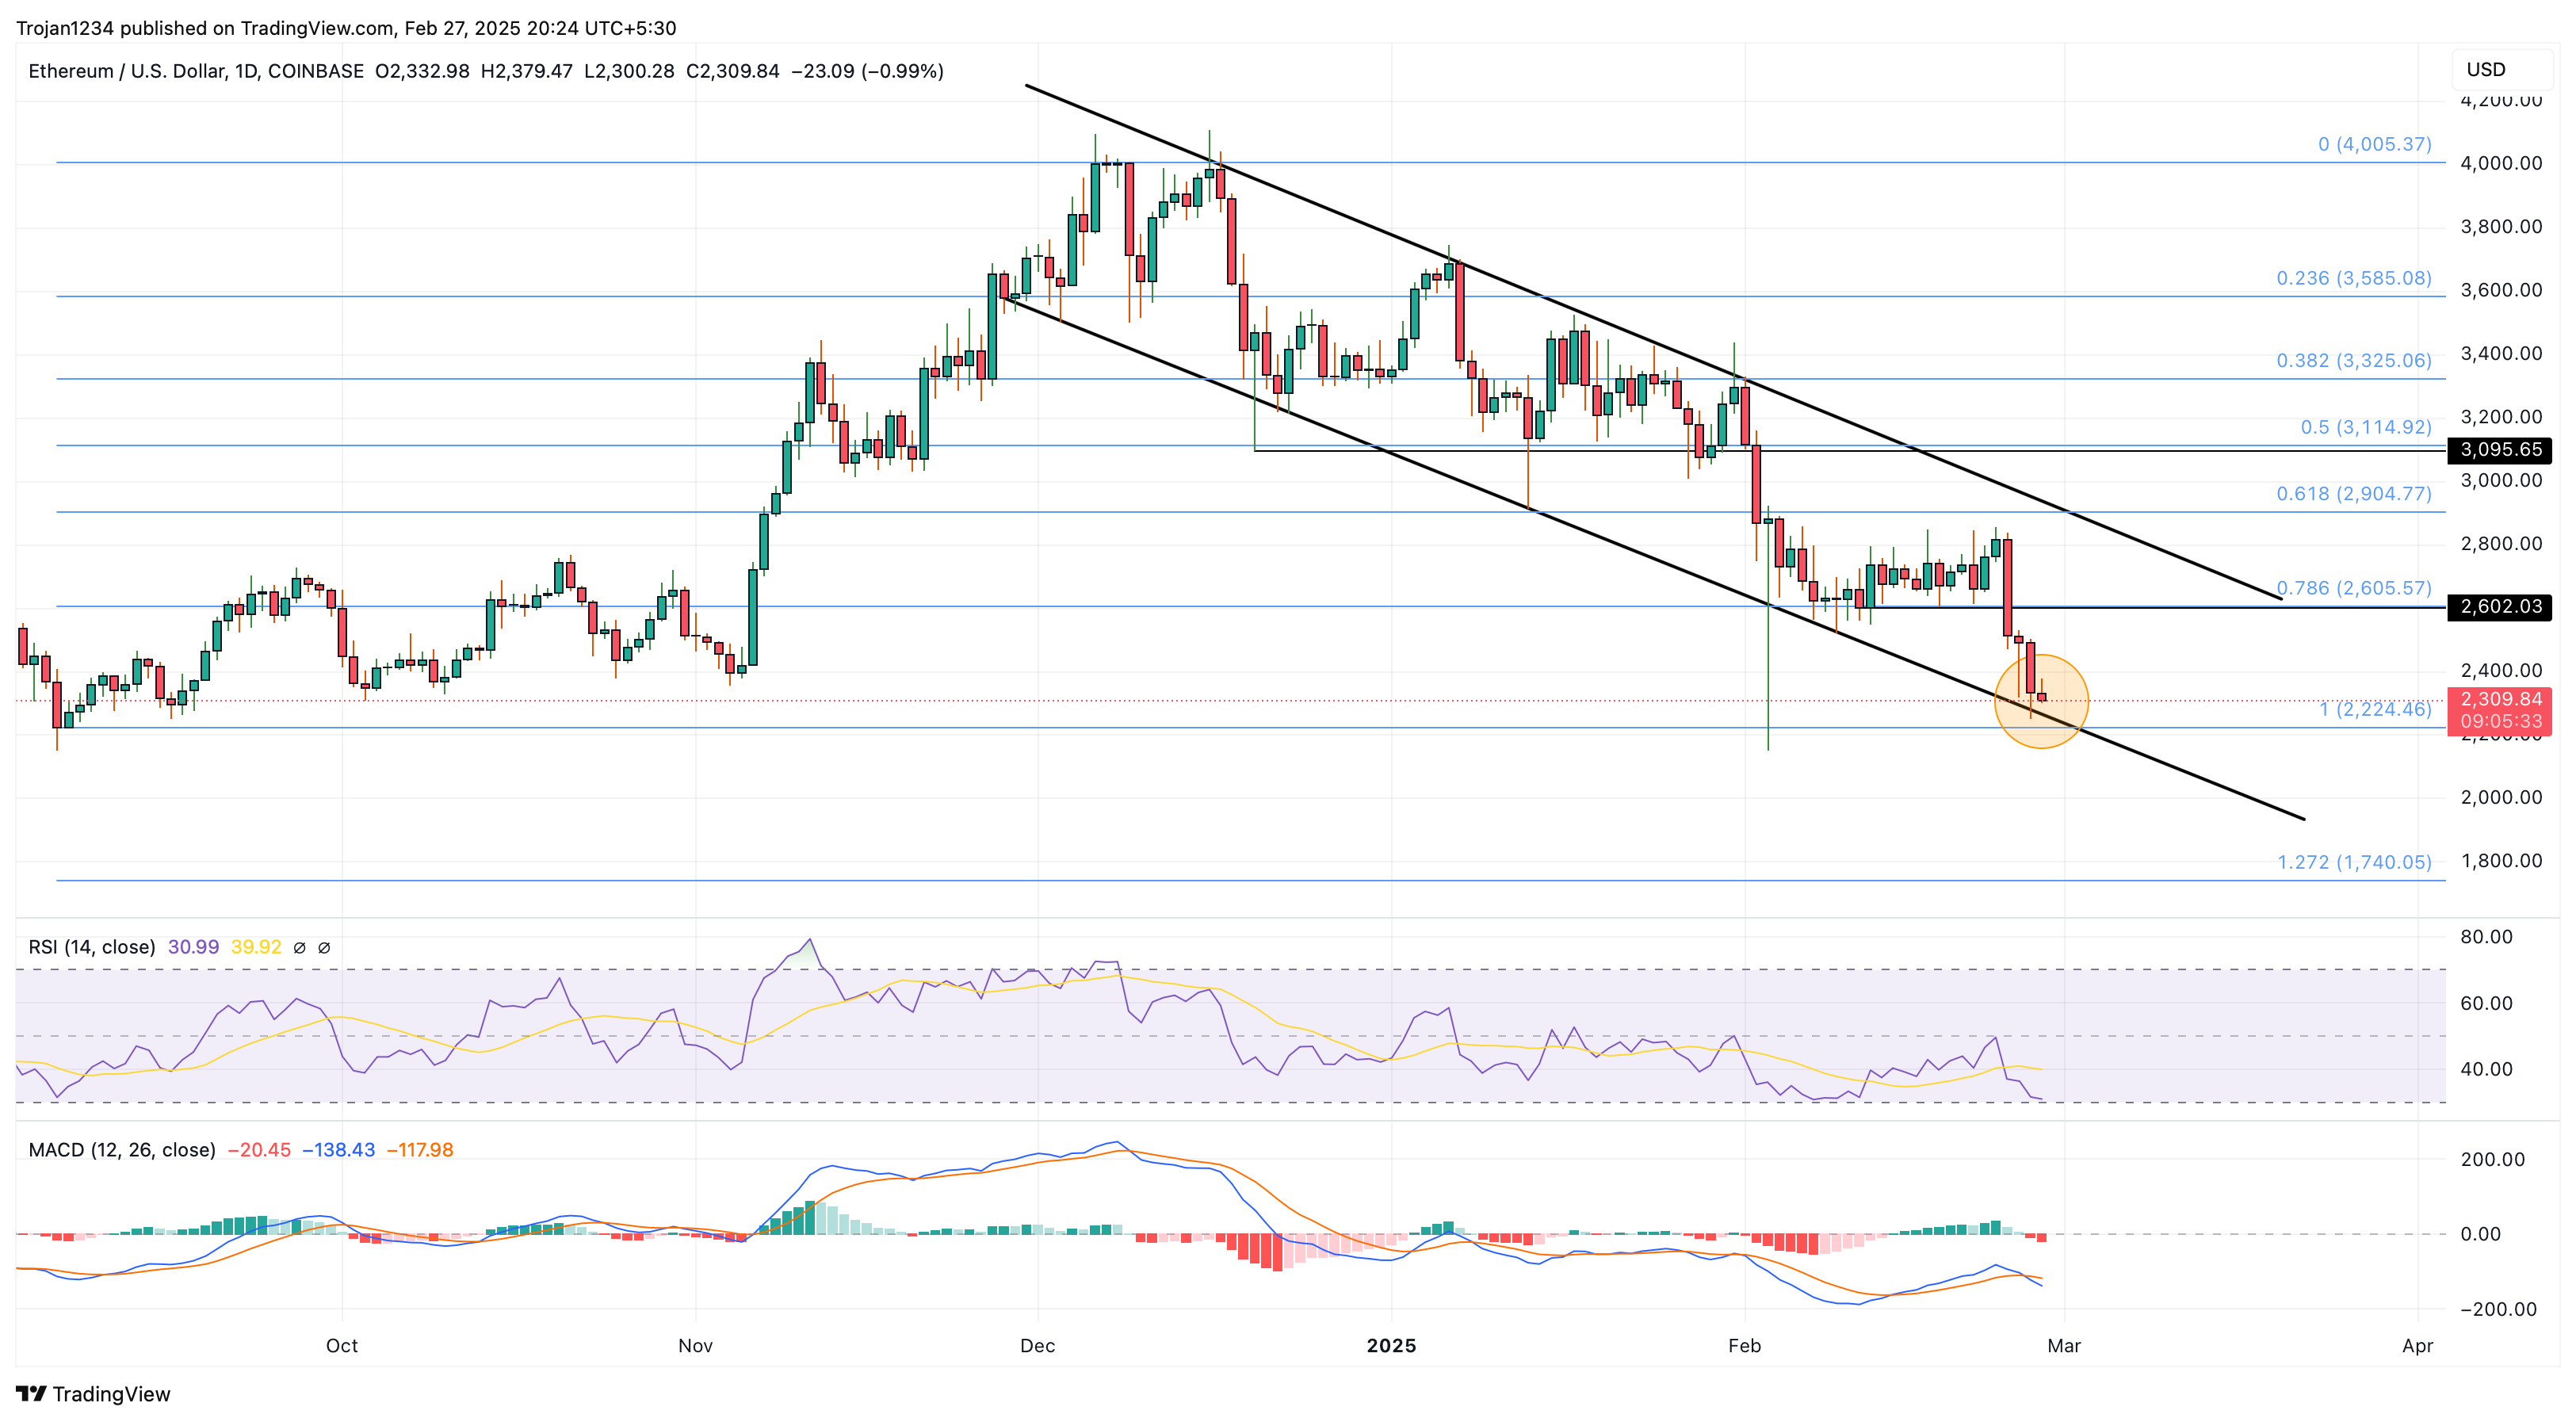
Bitcoin struggles near $85,000, contributing to a bearish trend affecting altcoins. Ethereum is currently priced at $2,309, marking its fourth consecutive bearish candle and nearing a critical support level.
Ethereum Price Trends
- ETH approaches local support trendline after breaking under $2,400.
- The price is testing the $2,224 horizontal level, indicating increased bearish pressure.
- MACD shows a bearish crossover, suggesting heightened bearish momentum.
- Daily RSI remains above the oversold boundary, hinting at potential for bullish movement.
Analyst Insights
- Analyst Titan of Crypto notes a Wyckoff check accumulation pattern on the weekly ETH chart, indicating potential for a bullish reversal if key levels hold.
- Ted Pillows identifies bullish divergence in ETH, projecting a possible short-term rally towards $2,600-$2,700.
Derivatives Market Analysis
- High implied volatility (70-90%) in ETH derivatives suggests expectations of significant price swings.
- A put-to-call ratio of 0.46 indicates bullish sentiment among traders.
- Current open interest is high, particularly near quarterly expirations.
Market Levels and Outlook
- Key levels: $2,400-$2,500 as battleground; max pain trending toward $2,800.
- Low DVOL of 68.32 reflects market underpricing volatility.
- Closing below $2,200 could lead to a drop under $2,000, with potential Fibonacci test at $1,740.
- On the bullish side, a reversal might reach the $2,600 mark.