
18 0
Dogecoin Forms Potential Double Bottom Pattern Indicating Possible Breakout

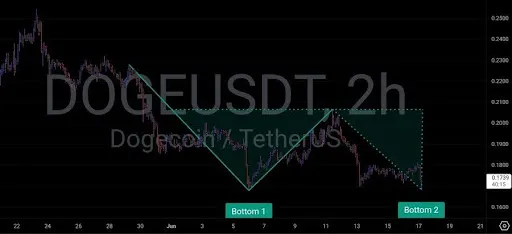
Crypto Sat has analyzed Dogecoin, indicating potential accumulation after a correction. The 2-hour chart suggests a double bottom pattern, which may lead to an upward movement if confirmed.
Key Insights
- First bottom established around $0.170; buyers defended this zone.
- Second test shows a higher low structure, indicating reduced bearish pressure.
- Neckline resistance is between $0.198 and $0.200; a breakout here would confirm market sentiment shift.
- Rising volume on the second bottom signals increased buyer conviction.
- Monitoring the resistance zone at $0.200; a strong breakout could lead to targets of $0.220 and $0.230.
- If DOGE fails to break the neckline, support at $0.165 is critical; maintaining above it keeps the bullish pattern alive.
Crypto Sat advises traders to remain patient and let the neckline determine the next significant move for DOGE.
Authors credited by the source: Godspower Owie
Published by Holder based on an external source.