
15 0
Toncoin May Experience 50% Price Move According to Analyst Analysis
A cryptocurrency analyst has identified a potential 50% price movement for Toncoin based on its current technical analysis pattern.
Key Insights on Toncoin's Price Movement
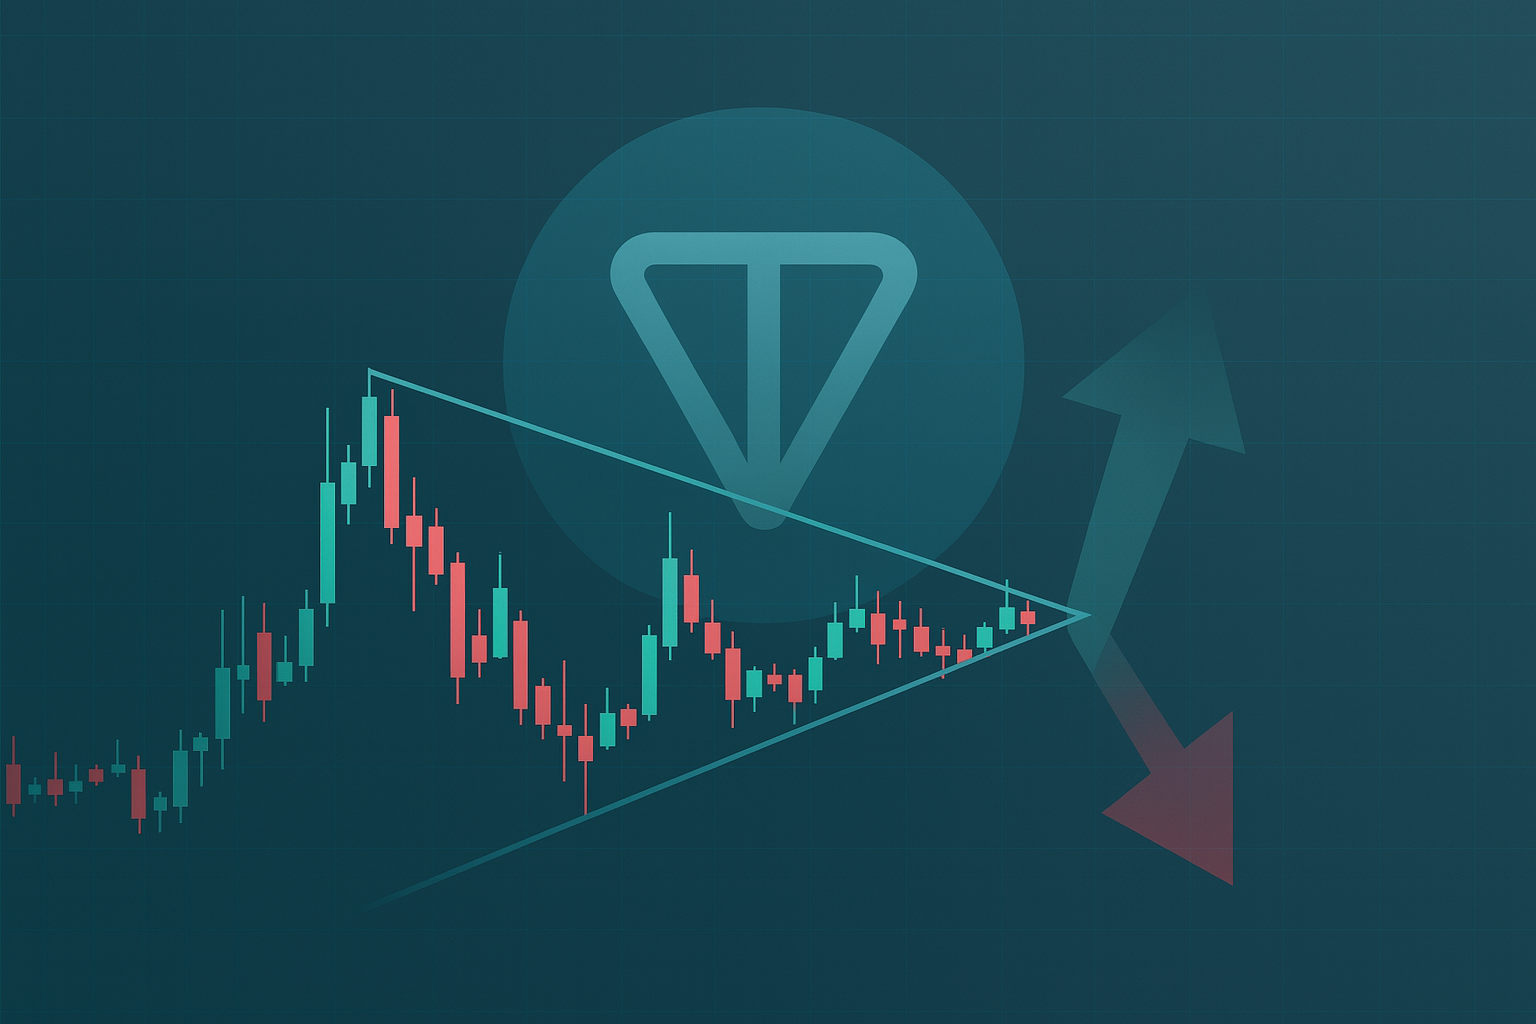
- Toncoin is forming a symmetrical triangle on its daily price chart.
- This pattern indicates price consolidation between two converging trendlines.
- Breakouts from symmetrical triangles have no directional bias, making moves likely in either direction.
- The closer the price approaches the apex of this triangle, the higher the likelihood of a breakout.
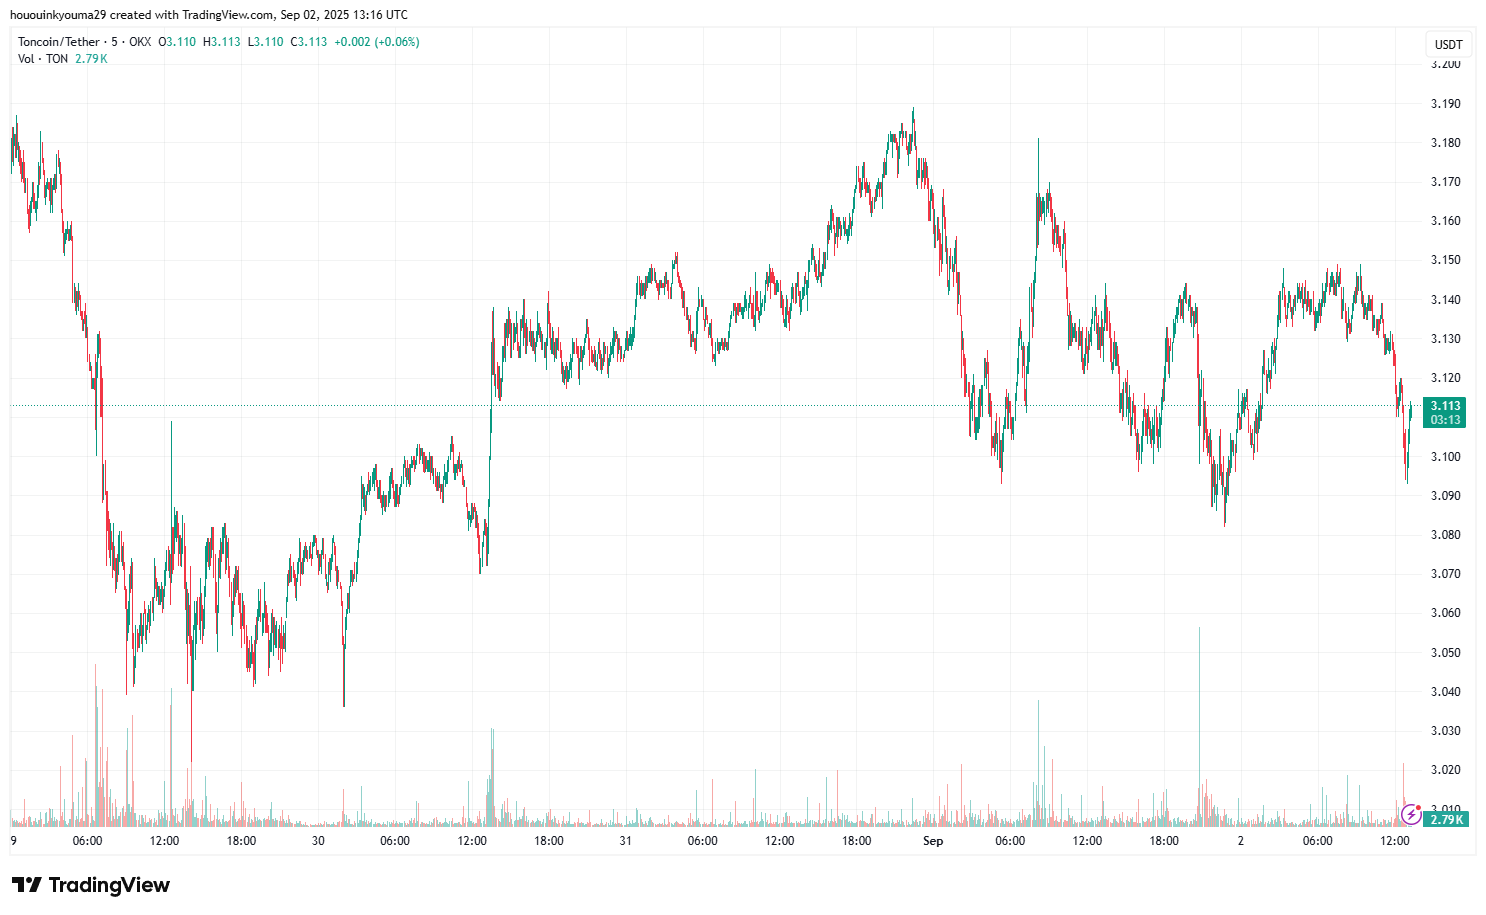
- Currently, Toncoin is testing the lower boundary of the triangle after recently recovering to $3.11 from a low of $3.04.
- Analysts suggest a breakout could lead to a 50% price movement.
Monitoring support at the lower boundary will be crucial as it may indicate further bearish or bullish trends.

Authors credited by the source: Keshav Verma
Published by Holder based on an external source.